USDA Forest Service
Most are Old; Many are Historic
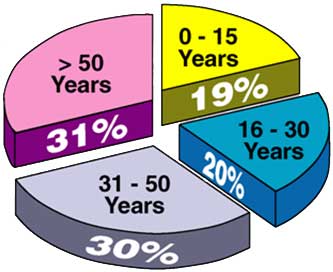
Distribtion of Buildings by Age
*Data from 2000
Back
|
Next
Cover Page
Home
9 of 26