United States
Department of
Agriculture
Forest Services
Technology &
Development
Program
7700Transportation Systems
September 1998
9877 1207SDTDC

|
Bridge Scour Evaluation:
Screening, Analysis,
& Countermeasures
|
Bridge Scour Evaluation: Screening, Analysis, & Countermeasures
Introduction
Scour, defined as the erosion or removal of streambed or bank material from bridge foundations due to flowing water is the most common cause of highway bridge failures in the United States. Virtually all of the 7,650 bridges on National Forest lands are administered by the U.S. Department of Agriculture (USDA) Forest Service. Scour is also the single most common cause for bridge damage and failure on National Forest System lands (figure 1). Many bridges will experience floods that can cause damage each year. Minimizing future flood damage to bridges and ensuring public safety requires engineers to develop and implement improved procedures for designing bridges and inspecting them for scour. Every bridge over water, should be assessed as to its vulnerability to scour in order to determine the prudent measures to be taken for that bridge and the entire inventory (Richardson and Davis 1995).
To meet this need, the Federal Highway Administration (FHWA) issued a Technical Advisory in 1988 revising the National Bridge Inspection Standards (NBIS) to require evaluation of all bridges for susceptibility to damage from scour. In accordance with the Memorandum of Understanding between the Forest Service and the FHWA, the Forest Service is required to implement the Technical Advisory, establish a scour evaluation program, and submit progress reports of the evaluation program to FHWA.
Prior to 1998, the Forest Service had not implemented a scour evaluation program. In 1998, an Engineering Technology Development Proposal was funded to develop a scour evaluation program, specifically for the Forest Service, that all regions of the Agency could implement. The project was to outline a single process and establish criteria, methods, and guidelines that would ensure consistency throughout the Agency and eliminate duplication of effort.
The project was completed in cooperation with the regional bridge engineers and was organized into three phases.
Phase 1. Review the FHWA guidelines and existing public road agency scour programs.
Phase 2. Develop a scour evaluation program specifically for the Forest Service based on the information from Phase I.
Phase 3. Provide support for the program during implementation by the regions.
This document is the culmination of Phases 1 and 2.
Implementing this process will provide valuable information and initiate proactive management of our bridge inventories. Managers will be able to prioritize needs and avoid many future bridge problems and failures. In addition, the process will provide valuable training, experience, and tools that will enhance the skills of employees who implement the program. This will benefit many future projects in our role of Caring For The Land, and Serving People.

|
|
Figure 1Little Salmon River Bridge, Nez Perce National Forest. A January 1997 flood event scoured the abutment and one of the intermediate piers, causing failure.
|
Scour Evaluation Reference Standards
The Technical Advisory issued by FHWA in 1988 provided recommendations for developing and implementing a scour evaluation program. Since that time, FHWA has developed the following two additional documents that have become the reference standards for all scour evaluation programs:
1. Hydraulic Engineering Circular No. 18 (HEC-18) Evaluating Scour at Bridges. (Richardson and Davis 1995)
2. Hydraulic Engineering Circular No. 20 (HEC-20) Stream Stability at Highway Structures. (Lagasse et al. 1995)
HEC-18 is the technical standard for knowledge and practice in the design, evaluation, and inspection of bridges for scour. HEC-20 provides guidelines for identifying stream instability problems at stream crossings that may cause scour damage to bridges or culverts (figure 2).
The Scour Evaluation Program outlined within this document also uses the two HEC documents as the primary reference standards. Successful implementation of the program will require knowledge, understanding, and use of these references.

|
|
Figure 2Left HEC 18, Evaluating Scour at Bridges; Center An Assessment Methodology for Determining Historical Changes in Mountain Streams; Right HEC 20, Stream Stability at Highway Structures.
|
Forest Service Scour Evaluation Program
The Forest Service Scour Evaluation Program is a four-step process similar to the five-step process recommended in HEC-18, chapter 5. The process objective is to provide a consistent, efficient method to review and evaluate all bridges over water, to determine the scour potential of each bridge, to assist in establishing priorities and identifying appropriate countermeasures, and to document the results. Figure 3 is a flow chart of the process. The four steps are:
Step 1 - Office Screening and Management Priority Analysis
Step 2 - Field Review, Scour Vulnerability Analysis, and Prioritizing
Step 3 - Detailed Scour Evaluation
Step 4 - Plan of Action
Each step is discussed in more detail in the following sections. Within each step of the process, bridges or major culverts are categorized according to the determined scour potential. (Categories are discussed under section Step 1) These categories also correspond to the Scour Critical Bridge field on the Structure Inventory and Appraisal form, item 113. As a bridge is evaluated through the process, a structure may be placed in a different category from the previous step, and the Scour Critical Bridges field code may also change. The process will be complete for a bridge when the coding of the Scour Critical Bridges field on the Structure Inventory and Appraisal form, item 113, is any value other than code 6, which is Scour calculation/evaluation has not been made.

|
|
Figure 3Forest Service Scour Evaluation Program, Four-Step Process.
|
Steps 1 and 2 provide guidelines and criteria to efficiently and economically screen as many bridges and major culverts as possible into the appropriate categories, identify proper Scour-Critical Bridge codes, and prioritize bridges. Step 3, Detailed Scour Evaluations, requires an experienced inter-disciplinary team. That, in most instances, will include technical expertise outside the Forest Service and is anticipated to be expensive. Steps 1 and 2 can be completed by Forest Service personnel or consultants.
All bridges should be first evaluated using Steps 1 and 2 because appropriate countermeasures can often be easily identified before proceeding to Step 3 on many of the single-span, smaller bridges that are rated scour critical.
Required Federal Highway Administration Reporting
In addition to coding the Scour Critical Bridges field on the Structure Inventory and Appraisal form, Item 113, for each bridge, FHWA requires the Forest Service to submit reports outlining the progress of the evaluation program. Appendix A is an outline of the report format and explanations for the different reporting categories. The progress reports should reflect the number of bridges and the appropriate coding for each bridge.
Documentation and Program Monitoring
Documentation is recommended for each bridge at each step of the process. Recommended documentation methods are described for each step in this report. In addition, INFRAstructure-Bridge and Major Culvert (INFRA-BMC) will remain the database and inventory for all Forest Service bridges and major culverts. Monitoring of each bridge through the scour evaluation process should be possible using INFRA-BMC with the following proposed changes:
Revise Scour Critical Bridge, item 113:
- Add new code U for Unknown Foundation.
- Add new code T for Tidal.
- Add new code LP for Low Priority. (This code will reflect bridges that are identified as low priority in Step 1b Management Priority Analysis, in the proposed Forest Service scour evaluation process).
Add new field Scour Vulnerability to the Appraisal fields. This field will assist in prioritizing the bridges during Step 2c of the scour-evaluation process. Proper codes are:
- H High Scour Vulnerability
- M/H Moderate- to High-Scour Vulnerability
- M Moderate-Scour Vulnerability
- M/L Moderate- to Low-Scour Vulnerability
- L Low-Scour Vulnerability
- ND Not Determined
With the proposed revisions to INFRA-BMC, various reports can be generated from the data to assist in monitoring the program process. A supplemental standard report will query INFRA-BMC for the data needed to generate FHWA progress reports. Maintaining the proper coding of INFRA-BMC for each bridge during the scour evaluation process should result in adequate monitoring capability.
Step 1 - Office Screening and Management Priority Analysis
Step 1a - Office Screening
Objective
The objective of Step 1a is to quickly review the current available documents within the bridge or major culvert file and screen them into five categories. As mentioned above, each category has corresponding codes with respect to the Scour Critical Bridge field on the Structure Inventory and Appraisal form, Item 113. It should be noted, that any bridge which has not been monitored to Step 1 in the process should have a code 6 for the Scour Critical Bridge field. The five categories and corresponding Scour Critical Bridge (item 113) codes are as follows:
| 1. |
Low Scour Risk |
|
| |
Item 113 corresponding codes |
4, 5, 7, 8, 9 |
| 2. |
Scour-susceptible |
|
| |
Item 113 corresponding codes |
6, LP |
| 3. |
Scour-critical |
|
| |
Item 113 corresponding codes |
0, 1, 2, 3 |
| 4. |
Unknown Foundations |
|
| |
Item 113 corresponding codes |
U |
| 5. |
Tidal |
|
| |
Item 113 corresponding codes> |
T |
These five categories are the same as recommended in HEC-18, chapter 5.
Office Screening Flow Chart
Figure 4 is a flow chart of Step 1 indicating the recommended steps in an office screening and the criteria for placing bridges and major culverts into the five categories. Documents needed are bridge plans and past inspection reports. Discussion on several of the various decision nodes within the flow chart follows.
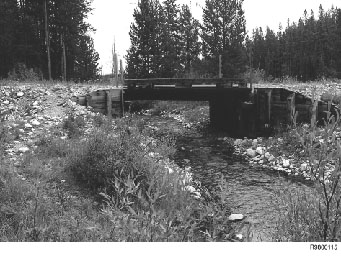
Pier/Abut/Ftg in Channel or Flood Plain: Structures are categorized as Low Scour Risk (figure 5) if plans indicate that all foundations are outside the channel and flood plain and well above floodwater elevations.
Pier/Abut/Ftg on Scourable Material: Plans indicate that all foundations are on nonscourable material. Structures are categorized as Low Scour Risk when nonscourable material is durable rock that is not susceptible to significant deterioration due to weathering and that scours at such a slow rate that changes occur over centuries.
Stream Velocity: Slow stream velocity is generally associated with lakes, tidal zones, or ditches and canals which experience very slow-moving, predominately static-flow conditions. All other streams, creeks, and rivers are considered rapid (figure 6).
Foundations: The foundation type is a primary influencing factor in determining the vulnerability to scour damage. Upon review of the inspection reports, bridges with deep foundations, such as long piles or drilled shafts, are placed in the low-risk category due to their low vulnerability to scour damage, thus completing their scour evaluation process. Shallow foundations, such as spread footings, short piles, mud sills, or cribs, are considered to have high vulnerability to scour. They are not recommended as low risk without proceeding to the Field Review, Step 2a. Lengths defining a long pile vs. a short pile have not been provided. Guidance should be provided on a regional basis, however, in the predominately glacier till soils of the Rocky Mountain States, 15 to 20 feet is being used to distinguish between deep and shallow pile foundations.
Bridges and major culverts are separated prior to reviewing the foundations. Major culverts usually have no foundations or are on shallow spread footings and should not be considered low risk without proceeding to the Field Review, Step 2a.
Unknown foundations should be placed in the same category as shallow foundations, requiring further review.
Inspection Reports: Prior to placing any structure in Category 1, Low Scour Risk, the inspection reports should be reviewed for indications of past or current scour problems. Scour damage should include not only damage to the structure itself, but also to approach fills. An abutment on a deep foundation may have a low vulnerability to scour damage structurally, but the approach fills may scour away, leaving a serious safety hazard, even though the bridge itself is not damaged. Review Substructure, Channel & Channel Protection, and Waterway Adequacy fields in the inspection reports. A numeric code of 5 or less in any of these fields (substructure must be due to observed scour) indicates potential scour problems and those bridges should be reviewed for the next step of the process. If a bridge has deep foundations, and the inspection reports do not indicate potential scour problems, the bridges are placed in Category 1, Low Scour Risk, and no further review is necessary.
Suggested Responsible Person(s)
The office screening can be completed by Forest Service bridge inspection team leaders or program managers or consultants with assistance from the regional bridge engineer.
Recommended Documentation
A simple method of documenting the office screening step is to highlight the decisions, path, and ending category in which the bridge was placed on the Office Screening Flow Chart (figure 4). A flow chart should be prepared for each bridge. Notes could be written on the flow chart. If electronic documentation is preferred, highlighting, shading, and typed notes can be added to the flow chart indicating the decisions, path, and ending category in which the bridge was placed.
Step 1b - Management Priority Analysis
Objective
Because funding and resources for detailed field reviews, scour evaluation studies, and implementing onsite scour countermeasures will be limited, the objective of Step 1b is to recognize that some Forest Service bridges and major culverts will have a much lower priority, regardless of the bridges scour vulnerability rating. Many Forest Service bridges are behind locked gates, have low traffic volumes, are not vital access routes, are older, or are small bridges with low present-worth values, where scour damage or complete washout would not create significant resource damage. These low-priority structures do not economically justify further evaluation or installation of any scour countermeasures. An acceptable mitigation plan for these structures is monitoring after flood events and closure, if necessary. Figure 7 outlines a process for Step 1b in which bridges and major culverts that have been screened into Categories 2, 3, or 4 in Step 1a, are quickly evaluated with respect to priority. Structures meeting certain criteria can be considered low priority without further review or evaluation. The action plan for these structures is monitoring.

|
|
Figure 4Forest Service Scour Evaluation Program -Office Screening Flow Chart. This figure breaks down step 1a from the overall diagram in Figure 3.
|
| |

|

|
|
Figure 5Libby Creek Bridge, Kootenai National Forest. Bridge footings are set into nonerodible bedrock as well as being outside the channel and well above floodwaters. Bridge is categorized as Low Scour Risk.
|
Figure 6Lake Koocanusa Bridge, Kootenai National Forest. Illustration of bridge crossing a body of water with slow stream velocities.
|
Management Priority Analysis Flow Chart
Figure 7 presents a flow chart of the recommended process and criteria for the Management Priority Analysis. Several of the various decision nodes within the flow chart are discussed below.
NBIS vs. Non-NBIS Structure: To evaluate bridges and major culverts with respect to traffic volumes and public use, distinguishing between a NBIS (National Bridge Inspection Standards) or Non-NBIS bridge is recommended. (A NBIS bridge or major culvert is one that is open to public travel and subject to the National Bridge Inspection Standards). A NBIS structure should remain in the scour evaluation process and proceed to the Field Review of Step 2.
Potential for Resource Damage: The bridge or major culvert should be reviewed for potential to resource damage if significant scour or complete washout occurs. Several possibilities to consider are:
- The amount of sediment that would be added to the creek or river with scour damage. In general, sediment comes from the approach fills, which many times are small; however, major culverts may be buried in high fills that would contribute much more sediment (figure 8).
- The debris from a bridge or major culvert that may damage other structures below.
The potential resource damage should be evaluated as Acceptable or Unacceptable. Structures with unacceptable potential for resource damage should remain in the scour evaluation process and proceed to the Field Review of Step 2.
Vital Access: A bridge or major culvert that may be closed to public travel (Non-NBIS) but is on a vital administrative route and would severely impact access to critical management areas should remain in the scour evaluation process and proceed to the Field Review of Step 2.

|
|
Figure 7Forest Service Scour Evaluation Program Management Priority Analysis. This figure breaks down Step 1b from the overall diagram shown in Figure 3.
|
| |

|
|
Figure 8Moss Creek, Idaho Panhandle National Forest. Piping and subsequent scour of this culvert resulted in failure of the entire fill, introducing a large amount of sediment into the stream. With Step 1b, Management Priority Analysis, the potential for resource damage at similar sites could be considered unacceptable.
|
Bridge Present Worth / Value: Non-NBIS bridges that are large, in good condition, or can be economically rehabilitated, and would have a high replacement cost should remain in the scour evaluation process for Step 2 Field Review. However, Non-NBIS bridges that are small, in poor condition, or can not be economically rehabilitated, and would have a low replacement cost would be good bridges to rate as low priority and to monitor.
Suggested Responsible Person(s)
The Management Priority Analysis should be the responsibility of the engineering forest staff officer, with assistance from the forest bridge inspection team leader or program manager, forest transportation planner, and resource specialists.
Recommended Documentation
Highlighting the decisions and path for the bridge on the Management Priority Analysis Flow Chart (figure 7) is a simple documentation method. Notes could also be written on the flow chart. If electronic documentation is preferred, highlighting, shading, and typed notes can be added to indicate the decisions.
Step 2 - Field Review, Scour Vulnerability Analysis, & Prioritizing
The bridges and major culverts placed in Categories 2, 3, and 4 in Step 1a for review through to Step 2 in Step 1b, may be screened further by completing Field Reviews and Scour Vulnerability Analyses. In addition, bridges are prioritized for further evaluation and/or implementation of scour countermeasures.
Step 2a - Field Review
Objective
The objective of the Field Review is to verify the inspection report information used during Step 1 and to gather additional field data necessary to complete a Scour Vulnerability Analysis. The Field Review is a comprehensive study of current scour problems as well as an analysis of the fluvial geomorphology of the stream.
Suggested Responsible Person(s)
The Field Review can be completed by Forest Service bridge inspection team leaders, or consultants. With some training, Forest Service bridge inspection team leaders should be able to gather the information in conjunction with the regularly scheduled bridge inspections.
Recommended Documentation
Documentation of the Field Review will be necessary to provide pertinent information for the Scour Vulnerability Analysis. More information is provided in the Step 2b discussion.
Step 2b - Scour-Vulnerability Analysis
Objective
With the information provided by the Field Review, bridges and major culverts may be further screened into appropriate categories and proper Scour Critical Bridge field codes. In addition, for many single-span, smaller bridges, the Scour Vulnerability Analysis may be adequate to determine the nature of a scour problem and the appropriate countermeasure or mitigation required.
Scour-Vulnerability Appraisal
Scour vulnerability is defined as the degree to which a bridge is open to attack or damage from forces and conditions causing scour. Scour vulnerability is related to but not idendical to the scour critical codes. If appropriate countermeasures are installed, the degree of scour vulnerability will probably decrease. Also, over time, site conditions may change, generating new factors that affect the degree of scour vulnerability. In addition, a bridges scour vulnerability will influence a managers priority decision. Therefore, a new field in the INFRA-BMC inventory has been proposed that will indicate the degree of scour vulnerability. The codes are:
- H High Scour Vulnerability
- M/H Moderate- to High-Scour Vulnerability
- M Moderate-Scour Vulnerability
- M/L Moderate- to Low-Scour Vulnerability
- L Low-Scour Vulnerability
- ND Not Determined
Available Methodologies
Various scour vulnerability analyses have been used by many agencies at similar points in their scour evaluation programs. A number of methodologies are available to complete the analysis and to estimate scour potential with limited information and without completing a full scour evaluation with an interdisciplinary team. Of the methodologies reviewed, a computer program developed by the University of Washington, called CAESAR, is recommended to the Forest Service at this step in the program. A discussion of the CAESAR program and two alternative methodologies follows.
CAESAR
The University of Washington has developed a computer program called Cataloging and Expert Evaluation of Scour Risk and River Stability at Bridge Sites (CAESAR). The program operates in a Windows environment and is structured in a question and answer format. Basic bridge data and Field Review data are required as input. The program outputs weighted recommendations pertaining to scour vulnerability, stream stability, and waterway adequacy. The program has two parts:
1. The user interface, through which site information is collected, stored, and retrieved. Textual and visual (graphs and photographs) help is provided. The Field Review data can be documented and stored within the program.
2. An evaluation module assesses the site conditions and provides recommendations (with confidence values) and suggested actions.
The program has been beta tested on several Forest Service bridges and was found to be an efficient and effective tool for completing and documenting the Field Review and Scour Vulnerability Analysis.
Colorado Highway Department Scour-Vulnerability Ranking Flow Charts
The Colorado Highway Department developed a series of Scour Vulnerability Ranking Flow Charts as part of their scour evaluation program. The flow charts outline a method to determine a vulnerability score for general site conditions, abutment scour vulnerability, and pier scour vulnerability. The flow charts are not as comprehensive as the CAESAR analysis and do not document the site conditions of the Field Review. Appendix B provides a copy of the flow charts and accompanying documentation.
Rapid-Estimation Method for Assessing Scour at Highway Bridges Based on Limited Site Data
The Montana U.S. Geologic Survey (USGS), in cooperation with the Montana Department of Transportation, developed a methodology for estimating scour depths that would (1) require only limited onsite data, (2) provide estimates of scour depth that would be reasonably comparable to estimates from more detailed methods and would tend to overestimate rather than underestimate scour depths, and (3) provide estimates for each site in a few hours or less (Holnbeck and Parrett 1997). The method was developed using calculated scour depths from 122 detailed scour evaluations of bridge sites in 10 States and formulating relationships between scour depth and hydraulic variables that can be rapidly measured in the field. Although the method was developed specifically for bridges in Montana, it is believed to be valid for a wide range of hydrologic and hydraulic conditions throughout the United States (Holnbeck and Parrett 1997). The method uses a Standardized Scour Analysis and Reporting Form which includes a worksheet for calculating the scour depths and a summary sheet for general field investigation information.
This method will provide a good assessment of scour vulnerability for a bridge with good documentation. The method will require more time than either the CAESAR program or the Colorado flow charts, good judgement, and a high level of expertise.
Suggested Responsible Person(s)
- The CAESAR program can be used by field personnel with little formal training in river mechanics and scour processes. Forest Service bridge inspection team leaders, program managers, or consultants can complete the Scour Vulnerability Analysis. Completion of a training session in stream stability and bridge scour is recommended.
- Colorado DOT scour vulnerability ranking flow charts should be completed by Forest Service bridge inspection team leaders, program managers, or consultants. Completion of a training session in stream stability and bridge scour is recommended.
- Rapid-Estimation Method For Assessing Scour at Highway Bridges Based on Limited Site Data, developed by USGS, requires a higher degree of expertise than the CAESAR program or the Colorado flow charts. To complete the vulnerability analysis using this method, qualified Forest Service hydraulic or bridge engineers or qualified consultants are recommended.
Recommended Documentation
Documentation will be dependent on the method used. An advantage of the CAESAR program is that the Field Review report and any subsequent Field Review data can be stored electronically along with the bridge evaluation. The proposed new field in INFRA-BMC (Scour Vulnerability) will provide a means for documentation within the bridge inventory.
Step 2c - Prioritizing Bridges
Objective
Throughout the scour evaluation process, bridge program managers will need to evaluate available resources, personnel, and funding required to complete more detailed bridge evaluations and implement countermeasures. Step 1b provides an initial priority screening. After the Scour Vulnerability Analysis, bridges remaining in Categories 2, 3, and 4, which require more detailed evaluations, need to be prioritized with respect to safety. Safety will be evaluated with respect to the determined scour vulnerability, the functional classification, and the road on which the bridge resides, along with National Forest road management policies. Due to the varied road management policies within the National Forests, a strict method for developing a prioritized list is not provided or recommended. Some general guidelines and criteria are suggested.
Priority Guidelines and Criteria
Each National Forest will need to determine how to prioritize and evaluate the safety risks of a bridge. A list of bridges separated between those on arterial, collector, or local roads, and sorted by scour vulnerability from high to low will provide managers with a basis to plan for needed resources and prioritize individual bridges for further evaluation. Additional information accompanying the list, such as the scour critical code, substructure condition code, and average daily traffic (ADT) values may be helpful. A supplement to this document will be a standard report to query INFRA-BMC as described above.
Suggested Responsible Persons
Prioritizing bridges should be the responsibility of the forest staff officer for engineering activities with assistance from the forest bridge inspection team leader or program manager, forest transportation planner, and resource specialists.
Step 3 - Detailed Scour Evaluation
Objective
Bridges that have gone through Steps 1 and 2 and remain in Categories 2, 3, and 4 will require a Detailed Scour Evaluation. HEC-18 indicates that this evaluation is to be completed by an interdisciplinary team of hydraulic, geotechnical, and structural engineers. The evaluation typically includes a detailed site review, estimated scour calculations, structural evaluation of the foundations under the estimated scour conditions, and the design of any necessary scour countermeasures. In addition, the results of a Detailed Scour Evaluation will subsequently establish proper Scour Critical Bridge field codes for the INFRA-BMC database.
Evaluation Criteria and Tools
Criteria and guidelines for a Detailed Scour Evaluation are outlined in the reference, HEC-18. FHWA recommends that a bridge be evaluated for the design flood and superflood conditions and have suggested the 500-year flood event.
HEC-18 presents the state-of-the-art in scour calculation methods and equations. A number of hydraulic computer programs are available for assisting in the calculation of scour depths, such as WSPRO, HEC-RAS, and BRI-STARS. Most of these programs use one-dimensional models and lack the capability to evaluate lateral flows and channel instabilities or meanders of the stream. Engineers must account for these effects separately, as well as evaluate the structure foundations for instability at the calculated scour depths.
For many streams and rivers, typically associated with mountainous bridge sites of the Forest Service, the evaluation of scour at a site is considered more of an art than a science. At these sites, stream morphology is a significant factor. Also, hydrologic estimates of these mountainous stream flood-event flows can have significant error. Therefore, in addition to the criteria and guidelines outlined in HEC-18 for a Detailed Scour Evaluation, the following is recommended:
- The interdisciplinary team should include a person with expertise in stream morphology such as a wildland hydrologist or a fluvial geomorphologist to assist in evaluating the potential of scour from lateral stream instabilities, long-term aggregation, or degradation, and so on.
- The scour evaluation should envelop estimated scour depths by calculating depths for the 50-year, 100-year, and 500-year flood events, and apply engineering judgement to achieve a reasonable and prudent evaluation of the bridge.
Suggested Responsible Person(s)
In most instances, the Detailed Scour Evaluation is should be completed by consultants with the interdisciplinary expertise required. Depending on the forest or region, the responsible person may be the national forest bridge program manager, forest engineer, or regional bridge engineer.
Step 4 - Plan of Action
Objective
The final step in the Forest Service Scour Evaluation Process is to develop a Plan of Action to correct scour problems for a bridge. The Plan of Action is the tool that closes the loop from evaluating and studying a bridge, to acknowledging and recognizing a problem, and, finally, to implementing field corrective measures. The Plan of Action may include interim scour countermeasures until permanent measures are installed, monitoring plans and/or inspections after flood events, and procedures for closing bridges, if necessary.
Suggested Responsible Person(s)
Depending on the forest or region, the responsible person to prepare the Plan of Action for a bridge may be the forest bridge program manager, forest engineer, or regional bridge engineer.
Recommended Documentation
A simple Plan of Action form is included in appendix C. The form should be completed for each bridge and retained in the bridge file. The form includes:
- Basic bridge identification information.
- The BMC/INFRA Scour Critical field coding.
- The proposed Scour Vulnerability coding with a brief description of the critical elements vulnerable to scour.
- Recommended scour countermeasures and implementation plan. Any design or drawings should be referenced. If scour countermeasures have been completed, some basic information should be included for future reference.
- Bridge Closure Plan. A bridge closure plan should identify the acceptable method of closing the bridge, such as gates or barricades, and any needed detour or safety signing.
Typical Forest Service Bridge
The Forest Service road system is similar in some ways to other public road systems because it includes roads open to the public with standards and traffic volumes similar to local county systems. But the Forest Service road system is also unique because it includes many roads not open to the public, which have reduced standards and very low traffic volumes. Forest Service bridges also reflect this diversity with some major, important, arterial bridges and many small, local road bridges. One objective in developing the Forest Service Scour Evaluation Program was to maintain flexibility in the process so that the wide variety of bridges could be evaluated efficiently with practical results.
The most significant difference in this program, when compared to the programs developed by each State, is Step 1b Management Priority Analysis. This step recognizes that many Forest Service bridges are of a low priority, regardless of the scour vulnerability of the bridge. The step provides flexibility early in the process to assess priorities and resources needed to complete the program.
Even though there are a wide variety of bridges in the Forest Service, a review of the Forest Service inventory indicates a few basic characteristics of a typical Forest Service bridge (figure 9).
- Typically a single-span bridge.
- Virtually all cross a stream or river.
- Average span is 50 feet with 80 percent of the inventory under 80 feet.
- Most common abutment substructure type is vertical walls supported on spread footings or mud sills.
- Bridges are on typically low-volume roads with Average Daily Traffic (ADTs) less than 100.
The majority of Forest Service stream crossings are on mountain streams with channel gradients between 0.01 and 0.10. Mountain streams are subject to highly variable discharges and are susceptible to large sediment loads from slope failures and debris flows (Smelser and Schmidt 1998). The streams typically flow between steep forest slopes with incised channels and nearly vertical, noncohesive banks composed of gravel and cobbles before entering valleys where the streams flow into larger streams and rivers. As the channel gradient drops, stream transport drops, causing aggradation and channel braiding. Meandering, slow-moving streams also occur in the large, flatter valley bottoms as well as occasionally in higher elevation open parks and swamps. Each of these stream channel types (steep incised, braiding, and meandering) have their own scour problems. Steep incised streams experience long-term degradation, braided streams (occurring at gradient changes) experience aggradation and stream instability, and meandering streams experience lateral channel migration and have very wide flood plains.
Scour associated with typical Forest Service bridges in similar channel types often will be of similar nature and cause. Therefore, it is also reasonable to assume that there may be common solutions or countermeasures. The following is a discussion of some of the most common problems and characteristics that may be evident on a typical Forest Service bridge.
|
|
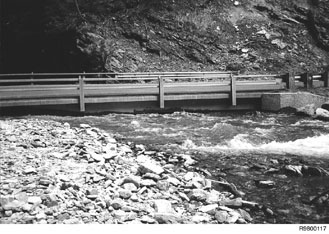
Figure 9LaMarche Creek Bridge, Beaverhead National Forest. Typical single-span, treated timber bridge supported on vertical wall abutments, with wingwalls, on mudsills crossing a mountainous stream.
|
Common Problems and Characteristics
Stream-Channel Instability
As described above, stream channel instability is a problem most commonly associated with braiding streams. Many Forest Service roads are located adjacent to larger rivers, and thus, many Forest Service bridges cross tributaries. As described above, many of these tributaries have grade changes as they approach the flood plain of the larger rivers, have braiding characteristics, and experience shifting and lateral migration. Bank erosion and changing angles of attach of the stream to the bridge cause local scour problems.
Bridge Geometry and Scour
Scour depth equations in HEC-18 use a coefficient for abutment shape. The coefficients are (Richardson and Davis 1995):
- Vertical wall abutment 1.00
- Vertical wall abutment with wingwalls 0.82
- Spill-through abutment 0.55
The coefficients indicate that spill-through abutments (trapezoidal-shaped channel through a bridge) decrease local scour depths significantly, compared to vertical wall abutments. Spill-through abutments provide a smoother transition through a bridge opening, eliminating abrupt corners that cause turbulent areas. Recent stream mechanics theory suggests that bridge abutments should span outside the bankfull stage of the stream, which corresponds to the discharge at which channel maintenance is the most effective, that is, the discharge at which moving sediment, forming or removing bars, forming or changing bends and meanders, and generally doing work that results in the average morphologic characteristics of the channels (Rosgen 1996). Flows above the bankfull stage are accommodated with adequate freeboard through the bridge or overflow channels. Again, spill-through abutments are more efficient hydraulically at higher flood stages, allowing more area and capacity than a vertical wall abutment (figure 10).

|
|
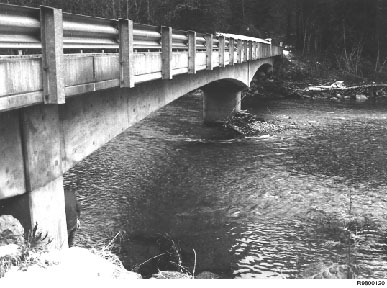
Figure 10Independence Creek Bridge, Idaho Panhandle National Forest. Example of a spill-through (trapezoidal) abutment configuration. See figure 9 for an example of a vertical wall abutment with wingwalls.
|
Aggradation
Mountainous streams generally have variable grades. Many have steep grades, yet flatten out substantially within a short distance of their confluence with a larger river. Aggradation within this flatter stream section can be a problem as the stream transports bedload off the steeper grades and deposits it as velocities slow along the flatter grades. High flows in a larger river where a smaller tributary joins can cause backwater in the smaller tributary, which can also cause aggradation. Over time, the aggradation may be balanced by isolated storm events which will flush (downgrade) out the tributary stream section. However, in the short term, this aggradation can be a problem to bridges. Continued aggradation can minimize clearance for debris passage and cause overtopping or scour damage to the bridge and approach roadways (figure 11).
|
|
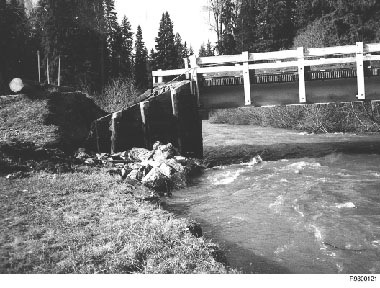
Figure 11Eagle Creek Bridge, Idaho Panhandle National Forest. Backwater effects from the main river caused aggradation at the mouth of this tributary and inadequate clearance for the bridge. Note, the following year the tributary flushed and the stream re-established the normal channel depth.
|
Long-Term Degradation
Another characteristic of mountainous streams is long-term degradation. Steep, incised channels will experience long-term degradation. When evaluating bridges for scour vulnerability, long-term degradation should be a factor. Many typical Forest Service bridges were built on spread footings with an embedment depth of only a few feet. Today, many of these bridges are of an age in which these footings will be exposed or undermined, mainly due to long-term channel degradation (figure 12).

|
|
Figure 12Shepherd Creek Bridge, Flathead National Forest. Long-term degradation has exposed the mudsill of this treated timber bridge with vertical wall abutments.
|
Contraction Scour
Contraction scour occurs when a channel narrows and stream velocities increase. Many Forest Service bridge spans are undersized by todays standards and contraction scour is present (figure 13).

|
|
Figure 13Vigilante Bridge, Beaverhead-Deerlodge National Forest. This 40-foot bridge constricts the channel and has caused upstream aggradation and contraction scour through and below the bridge.
|
Abutment Scour
Abutment Scour is commonly termed local scour. Local scour involves removal of material from isolated areas caused by an acceleration of flow past an obstruction and the subsequent turbulent water (vortices). Local scour is accentuated by debris buildup or stream instabilities that shift the stream toward one abutment or change the angle of attack. The most common locations for local scour on a typical Forest Service single-span bridge with vertical wall abutments is adjacent to the upstream and downstream corners intersecting the wingwalls.
|
|
Figure 14Irene Bridge over Cascade River, Mt. Baker-Snoqualmie National Forest, Region 6. Drift buildup on upper side of pier.
|
HEC-18 provides equations for predicting abutment scour, however, HEC-18 also states that the laboratory research to date has failed to replicate field conditions and these equations generally give excessively conservative estimates of scour depths. Therefore, engineering judgement is required in the use of these equations when evaluating or designing abutment foundations for scour.
Debris
Debris can have a significant impact on bridge scour in a number of ways (figure 14):
- Buildup of debris can reduce a bridges waterway opening, causing contraction scour of the channel.
- Buildup of debris can increase the obstruction area of a pier or abutment and increase local scour.
- Debris can deflect the flow of the water, changing the angle of attack, and increasing local scour or shifting the entire channel around the bridge altogether.
- Water action against debris can place a substantial lateral force on the bridge.
Debris is associated with many scour problems on a typical Forest Service bridge and must be considered carefully. However, debris problems and the associated scour are difficult to anticipate and remedy on existing bridges. New bridge designs can account for potential debris problems by oversizing spans, providing additional freeboard (distance between normal water level and top of bridge), and minimizing or eliminating piers in the channel. Typical countermeasures for an existing bridge with a debris problem include:
- Monitoring debris buildup for prompt removal.
- Clearing upstream debris.
- Installing debris catchers/deflectors.
A debris catcher/deflector on mountainous streams requires maintenance and careful consideration with respect to stream mechanics. A catcher/deflector could cause the stream channel to shift, resulting in other scour problems.
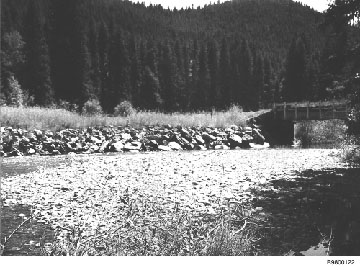
Abutment Fill Failures
During many flood events, the structure and foundations of the bridge will not be damaged, but the fill behind an abutment will scour (figure 15). This commonly occurs on a typical Forest Service single-span bridge with vertical wall abutments. Local scour occurs around the wingwalls or undermines the abutment footing and subsequently scours the approach fill away. To a user on the road, an abutment fill failure can be just as hazardous as a bridge failure. For this reason, abutment fill failures due to scour should be included in determining the scour vulnerability of a bridge.
|
|
Figure 15Monture Bridge, Lolo National Forest. An example of abutment fill failure with little damage to the bridge.
|
Common Countermeasures
The FHWA saw the need to identify common scour countermeasures and provide guidelines for their use. They published HEC-23, Bridge Scour and Stream Instability Countermeasures (Lagasse et al. 1997) to provide guidance for scour countermeasure applicability, design, installation, and maintenance, highlighted by a countermeasure matrix. Many of the countermeasures that will apply to typical Forest Service bridges are included.
Riprap
Within HEC-18, riprap is included under Local Scour Armoring. Riprap is, and probably will remain, one of the primary scour countermeasures to resist local scour forces at abutments of typical Forest Service bridges. Riprap is generally abundant, inexpensive, and requires no special equipment. However, proper design and placement is essential. HEC-18 and HEC-23 provide guidelines for proper sizing and placement (figure 16).
|
|
Figure 16Monture Bridge, Lolo National Forest. Repair of abutment fill failure and use of riprap as a scour countermeasure.
|
When designing riprap countermeasures, maintaining an adequate hydraulic opening through the bridge must be considered. Many times, improperly placed riprap will reduce the hydraulic opening significantly and create contraction scour problems.
Spur Dikes, Barbs, Groins, and Vanes
Spur dikes, barbs, groins, and vanes are considered river training structures that alter stream hydraulics to mitigate undesirable erosional and/or depositional conditions. They are commonly used on unstable stream channels to redirect stream flows to a more desirable location through the bridge (figure 17).

|
|
Figure 17Fisher River Bank Stabilization, Kootenai National Forest. Use of rock vanes to protect the stream bank from scour.
|
Foundation Strengthening
On a typical Forest Service bridge, foundation strengthening requires extending the footing deeper to offset long-term degradation, providing additional tiebacks on a vertical wall abutment if scour has caused loss of support and the abutments have begun to kick in, or installing a new abutment with deeper footings or piles.
Literature Cited
CAESAR, an Expert system for the Cataloging and Expert Evaluation of Scour Risk and River Stability at Bridge Sites. University of Washington, Department of Civil Engineering, National Cooperative Highway Research Program, Project 24-6. Transportation Research Board, National Research Council.
http://maximus.ce.washington.edu/~scour/.
Colorado Highway Department. 1990. Colorado Bridge Safety Assurance Procedure. Ref: 1514. April 1990.
Holnbeck, S.R. and C. Parrett. 1997. Method For Rapid Estimation of Scour At Highway Bridges Based On Limited Site Data. U.S. Geological Survey, Water-Resources Investigations Report 96-4310, pp. 1-3.
Lagasse, P.F., J.D. Schall, F. Johnson, E.V. Richardson, and F. Chang. 1995. Stream Stability at Highway Bridges, Second Edition. U.S. Department of Transportation, Publication No. FHWA-IP-90-014. Hydraulic Engineering Circular No. 20.
Lagasse, P.F., M.S. Byars, L.W. Zevenbergen, and P.E. Clopper. 1997. Bridge Scour and Stream Instability Countermeasures. U.S. Department of Transportation, Publication No. FHWA-HI-97-030. Hydraulic Engineering Circular No. 23.
Richardson, E.V. and S.R. Davis. 1995. Evaluating Scour at Bridges, Third Edition. U.S. Department of Transportation, Publication No. FHWA-IP-90-017. Hydraulic Engineering Circular No. 18, pp. 2, 48.
Rosgen, D. 1996. Applied River Morphology. Lakewood, CO: Western Hydrology.
Smelser, M.G. and J.C. Schmidt. 1998. An Assessment Methodology for Determining Historical Change in Mountain Streams. U.S.Department of Agriculture, Forest Service, Rocky Mountain Research Station, General Technical Report RMRS-GTR-6, p. 1.
Appendix A
| |
Required FHWA Reporting |
Enclosure A |
| |
| |
Bridge Needing Underwater Inspection |
|
| |
| |
|
|
Region |
| |
|
|
Date |
| |
| |
|
NUMBER OF BRIDGES |
| Reporting Categories |
NBI CODE |
NBIS |
NON-NBIS* |
TOTAL NUMBER |
| In Master List |
92B |
|
|
|
| Initial Inspection |
|
|
|
|
| Completed |
93B |
|
|
|
| Observed to Have |
|
|
|
|
| Structural Problems |
--- |
|
|
|
| Observed to Have |
|
|
|
|
| Scour Problems |
--- |
|
|
|
| Corrective Actions |
|
|
|
|
| Completed |
--- |
|
|
|
| |
| * Includes bridges over waterways which are less than 20 in length. |
| |
| Note 1: The total number of bridges needing underwater inspection is for those bridges requiring special manpower, techniques or equipment for determining the condition of underwater elements with certainty. This total would not include bridges than can be examined from above by wading, probing, or adequate visual inspection. |
| |
Required FHWA Reporting |
Enclosure B |
| |
| |
Bridges scour evaluations |
|
| |
| |
|
|
Region |
| |
|
|
Date |
| |
| |
|
NUMBER OF BRIDGES |
| Reporting Categories |
NBI ITEM 113 CODE |
NBIS |
NON-NBIS* |
TOTAL NUMBER |
| 1. Over waterways |
--- |
|
|
|
| 2. Evaluation Total |
--- |
|
|
|
| A. Low Risk Total |
4,5,7,8,9 |
|
|
|
| B. Scour Susceptible |
6 |
|
|
|
| C. Unknown Foundations |
U |
|
|
|
| D. Scour Critical |
0 - 3 |
|
|
|
| E. Tidal |
T |
|
|
|
| 3. Analyzed for Scour |
--- |
|
|
|
| 4. Countermeasures Installed |
7 |
|
|
|
| 5. Monitoring Planned |
--- |
|
|
|
| |
| NOTE: LOW RISK TOTAL IS INCLUDED ABOVE |
| |
| |
|
NUMBER OF BRIDGES |
| Reporting Categories |
NBI ITEM 113 CODE |
NBIS |
NON-NBIS* |
TOTAL NUMBER |
| 2A. Low Risk Total |
--- |
|
|
|
| (1) Calculated or |
4, 5, & |
|
|
|
| Assessed |
7-9 |
|
|
|
| (2) Screened |
6 |
|
|
|
| (3) Culverts |
8 |
|
|
|
| |
| * Includes bridges over waterways which are less than 20 in length. |
Notes for Enclosures A and B
The following notes are keyed to the National Bridge Inventory (NBI) as documented in the Recording and Coding Guide for the Structure Inventory and Appraisal of the Nations Bridges, December 1995 (metric version). Item numbers and codes are described in the coding guide. Category number refer to the reporting form categories.
| Category |
Explanation |
| 1 |
Equals sum of bridges with NBI Item 42B, coded 5-9. |
| 2 |
Equals the sum of Categories 2A, 2B, 2C, 2D, and 2E. This sum should also equal Category 1, Over Waterways, when screening is complete. A bridge should be included in only one of the categories under 2. |
| 2A |
Equals the sum of Categories 2A (1), 2A(2) and 2A(3). |
| 2A(1) |
Equals the sum of (a), (b), and (c) described below: |
| (a) |
bridges assessed during scour screening with code 8 (spread footing on competent rock) code 9 (foundation well above flood elevations) |
| (b) |
bridges analyzed as stable : codes 4, 5, and 8 and |
| (c) |
bridges protected by countermeasures, code 7 |
| 2A(2) |
Bridges assessed as low risk during scour screening activity, code 6. (These bridges are candidates for scour analysis, but lower priority than category 2B) |
| 2A(3) |
Culverts assessed during scour screening as code 8. |
| 2B |
Bridges assessed during scour screening as requiring scour analysis, code 6 |
| 2C |
Bridges assessed with unknown foundations, code 6 |
| 2D |
Bridges analyzed as scour critical, codes 0-3 |
| 3 |
Total number of bridges that have been analyzed for scour |
| 4 |
Scour critical bridges that have been protected with a structural countermeasure (riprap, paving, etc.) |
| 5 |
Scour critical bridges to be monitored. (structural countermeasures have not been constructed.) |
| 4&5 |
The sum of categories 4 and 5 should equal category 2D, scour critical bridges. |
| Definitions |
| Assessed |
The structure has been screened for obvious conditions and evaluated using engineering judgement. |
| Analyzed |
The structure has received a full engineering evaluation which includes calculation of hydrology, hydraulics, scour and foundation stability. |
Appendix B
2. Step Two
Ranking the bridges in each category as to scour vulnerability.
a. Scour Vulnerability Ranking Flow Charts.
The ranking of the scour vulnerability of those bridges determined to be scour susceptible, is obtained by flow charts that evaluate the vulnerability on the basis of the bridges geologic, hydraulic and river conditions as well as the conditions of the bridges foundation (abutments and piers).
The purpose of the Vulnerability Ranking Flow Charts is to provide a procedure to prioritize the list of scour susceptible bridges by determining the relative scour vulnerability of all bridges in each scour susceptibility category. The numerical values included in the flow chart were selected to give the relative effect of each parameter on the potential to produce scour. For example, the river slope/velocity parameter for steep, medium and mild conditions is valued at 2, 1 and 0 respectively because a steep slope will produce deeper scour than a mild slope. The values in each parameter are such that the most scour vulnerable bridge will have the largest value. More than one bridge can have the same value of vulnerability.
The value of the vulnerability ranking is that it orders a bridge relative to other scour vulnerable bridges, and other things being equal (traffic counts for example) determines what bridge should be repaired or replaced first.
The Scour Vulnerability Ranking has three flow charts. They are: 1) General Considerations, 2) Abutments and 3) Piers, which proceed sequentially. It is expected that field evaluation of the bridge will be required to complete the ranking.
b. General Conditions Flow Chart.
The General Conditions Flow Chart addresses parameters that have a general impact on the potential scour depth. The need for intermediate scour countermeasures is included in the flow chart to remind the evaluator to identify this need. No vulnerability ranking value is assigned to this parameter because it is expected that the countermeasures will be implemented before the detailed scour evaluation and installation of remedial measure is complete. The intermediate scour countermeasures are intended to protect the bridge from catastrophic failure until the design and construction of remedial measures is completed.
The remaining parameters are included for the following reasons:
(1) River Slope/Velocity - A steeper/faster flowing stream is expected to experience more severe scour than one with a medium or mild slope. The stream slope is defined as follows:
i) Steep S>0.0015 ft/ft
ii) Medium 0.0015 < S > 0.0004 ft/ft
iii) Mild S < 0.0004 ft/ft
(2) Channel Bottom - An aggrading condition is given a value of 0 because the slight deposition represented reflects a decrease in scour potential. Severe deposition that restricts capacity is addressed later in the flow chart. A stable channel condition is, therefore, given a value of 1 because it represents a more scour prone condition than aggradation. Similarly, a degrading channel is given a value of 2.
(3) The channel bed material are ranked because rock would take more time to erode to maximum scour than sand. The other material also would take more time. Thus, in ranking bridges to scour vulnerability the bridge that takes longer for scour to reach its maximum value would be less vulnerable.
(4) Channel Configuration - A meandering or braided channel is given a value of 2 because they have the most potential to have scour problems. A straight channel, defined as exhibiting a sinuosity of less than 1.5, is given a value of 0 because it is the least likely to affect scour. However, if a straight channel has bar formations that shift the thalweg, it should be given a values of 1.0.
(5) Debris/Ice Problem - Watershed, river conditions or pier and abutment configurations that promote debris and ice accumulation, primarily as indicated by historic records or field observations, warrant a value of 1 because the accumulation increases potential scour depth by either reducing the conveyance area or by increasing the effective pier width.
(6) Near River Confluence - The potential for increased flow and river velocity near a river confluence and the resultant scour potential, warrants use of the value of 1 for this condition.
(7) Affected by Backwater - Locations affected by backwater for all flow conditions, primarily resulting from proximity to a dam, warrants use of a value of 0. For this condition backwater from a downstream waterway should not be considered because it may not occur concurrently with peak flow and velocity on the tributary and at the location being studied.
(8) Historic Scour Depth - Historic scour indicates a clear potential for continued and increased scour activity. Historic scour depths in excess of 3 are a concern because spread footings are seldom deeper than this.
(9) Historic Maximum Flood Depth - Flow depth is a parameter in the scour prediction equations. Deeper flow is expected to produce greater scour.
(10) Adequate Opening - An inadequate opening is expected to produce greater scour than a restricted one, therefore, a value of 2 is assigned to this condition. This parameter also addresses the deposition of material in the channel at the structure to the point that the capacity of the bridge opening is restricted. Bridges that experience overtopping and thus have pressure flow should also be given a 2.
(11) Overflow/Relief Available - The ability of the design flow to proceed downstream by a means other than through the structure, usually by way of a relief structure or by overtopping the roadway embankment, reduces the scour potential at the structure being evaluated because the resultant discharge and velocity are less than would otherwise be the case.
(12) Simple Spans - This parameter recognizes that the ramifications of scour at simple span structures is more severe than would occur for structures with alternate load paths that probably would not experience catastrophic failure due to the loss of some foundation material.
The sum of the vulnerability ranking scores is tabulated at the bottom of the form before proceeding to the abutment vulnerability ranking flow chart.

|
|
Figure B-1General Conditions Scour Vulnerability Ranking Flow Chart
|
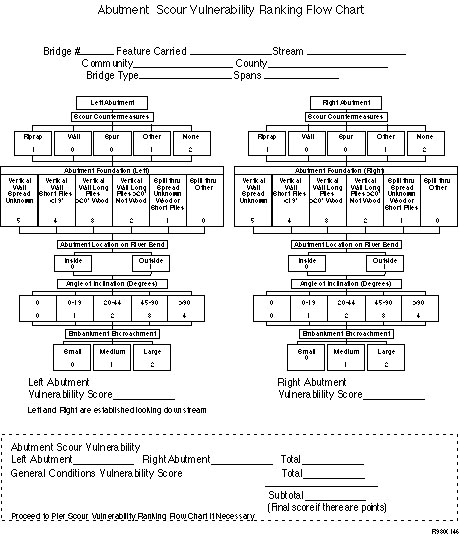
c. Abutment Vulnerability Flow Chart.
The abutment vulnerability assessment flow chart is intended to evaluate the relative vulnerability of a bridge to scour considering factors that affect abutment scour. A separate evaluation is provided for each abutment because the scour producing parameters may vary at each one, although it is expected that the abutment foundation configuration will remain the same. The left and right directions are established looking downstream. The parameters evaluated in the abutment vulnerability ranking flow chart reflect their relative effect on scour vulnerability as discussed for the office review flow chart. The rationale for their use follow:
(1) Scour Countermeasures - Installation of a wall or spur dike (guide bank) represent a relatively permanent countermeasure and are, therefore, provided the lowest value. Riprap and other countermeasures are considered temporary and are, therefore, given a higher value. The absence of scour countermeasures warrant assignment of the highest value. Location that do not require scour countermeasures, as indicated in the general conditions flow chart, should be given a value of 0 for this parameter.
(2) Abutment Foundation - The value assigned to each classification of abutment configuration and foundation type reflects their relative susceptibility to scour as discussed for the office review flow chart.
(3) Abutment Location on River Bend - An abutment located on the outside of a bend is more susceptible to scour than one on the inside of the bend or one on a straight channel and is, therefore, given a higher value than the other conditions.
(4) Angle of Inclination - The angle of inclination is determined in accordance with Figure 4.11 of the Technical Advisory. Relative values are assigned to each range of angles.
(5) Embankment Encroachment - The magnitude of the scour encroachment is reflected in most of the abutment scour equations, therefore, this parameter is included in the chart. A large encroachment would be considered one that substantially reduces the overbank flow area available for the conveyance of peak discharges. A small encroachment would be considered one that impacts less than 10 percent of the total discharge for the design discharge.
The abutment vulnerability score for each abutment is tabulated and summarized at the bottom of the form. The intermediate vulnerability score from the general conditions flow chart is also tabulated and added to the total abutment score to yield the subtotal, which is the final score, if the bridge does not have any piers. The presence of piers necessitates continuation of the evaluation by proceeding to the pier vulnerability ranking flow chart.
|
|
Figure B-2Abutment Scour Vulnerability Ranking Flow Chart
|
d. Pier Vulnerability Flow Chart.
The pier vulnerability assessment flow chart is intended to evaluate the relative vulnerability of a bridge to scour considering factors that affect pier scour. A separate evaluation is provided for each pier because the scour producing parameters may vary at each one. The piers are numbered sequentially from the left abutment, with the left side established looking downstream.
The parameters evaluated in the pier vulnerability ranking flow chart reflect their relative effect on scour. The rationale for their use follows:
(1) Scour Countermeasures - The rationale is the same as presented for the abutment flow chart.
(2) Pier Foundation - A spread footing or unknown foundation condition warrants a higher value than a pile foundation.
(3) Skew Angle - The skew angle ranges reflect the relative effect on scour potential as indicated in Table 4.3 of the Technical Advisory (FHWA 1987).
(4) Pier/Pile Bottom Below Streambed - This parameter reflects the relative susceptibility to scour based on the depth of the footing or pile bottom to the streambed elevation. The highest value is assigned to a depth of three feet or less because this is the normal depth of spread footings. Deeper footing or pile bottom elevations warrant lower ranking values. Depths greater than twenty feet are arbitrarily assigned the lowest value.
(5) Pier Width - The pier width reflects the maximum expected scour in accordance with pier scour questions as indicated in the Technical Advisory. The range of three to five feet in the pier width represents the normal dimensions expected. No adjustment for debris or ice accumulation is used here because it is reflected in the general conditions flow chart.
The pier vulnerability score is tabulated for each pier evaluated. The values are summarized and the value of the most vulnerable pier added to the subtotal from the abutment vulnerability flow chart to determine the total vulnerability score.

|
|
Figure B-3Pier Vulnerability Ranking Flow Chart
|
Appendix C
FOREST SERVICE SCOUR EVALUATION PROCESS
PLAN OF ACTION
Region ___________________________________
Forest ___________________________________
Route ID & MP ____________________________
Name ___________________________________
Feature Crossed __________________________
NBIS / Non-NBIS __________________________
BMC / INFRA Codes
Scour Critical ____________
Scour Vulnerability ________
Description of Bridge Vulnerability ________________________________________________
____________________________________________________________________________________
____________________________________________________________________________________
____________________________________________________________________________________
____________________________________________________________________________________
Recommended Scour Countermeasures
____________________________________________________________________________________
____________________________________________________________________________________
____________________________________________________________________________________
____________________________________________________________________________________
____________________________________________________________________________________
Implementation Plan
____________________________________________________________________________________
____________________________________________________________________________________
____________________________________________________________________________________
____________________________________________________________________________________
____________________________________________________________________________________
Bridge Closure Plan
____________________________________________________________________________________
____________________________________________________________________________________
____________________________________________________________________________________
____________________________________________________________________________________
____________________________________________________________________________________
For Additional Information Contact:
Forest Management Program Leader
San Dimas Technology & Development Center
444 East Bonita Avenue, San Dimas CA 91773-3198
Phone 909-599-1267; TDD: 909-599-2357; FAX: 909-592-2309
E-mail: mailroom_wo_sdtdc@fs.fed.us
Information contained in this document has been developed for the guidance of employees of the Forest Service, United States Department of Agriculture (USDA), its contractors, and cooperating Federal and State agencies. The USDA assumes no responsibility for the interpretation or use of this information by other than its own employees. The use of trade, firm, or corporation names is for the information and convenience of the reader. Such use does not constitute an official evaluation, conclusion, recommendation, endorsement, or approval of any product or service to the exclusion of others that may be suitable.
The U.S. Department of Agriculture (USDA) prohibits discrimination in all its programs and activities on the basis of race, color, national origin, sex, religion, age, disability, political beliefs, sexual orientation, or marital or family status. (Not all prohibited bases apply to all programs.) Persons with disabilities who require alternative means for communication of program information (Braille, large print, audiotape, etc.) should contact USDA's TARGET Center at (202) 720-2600 (voice and TDD).
To file a complaint of discrimination, write USDA, Director, Office of Civil Rights, Room 326-W, Whitten Building, 1400 Independence Avenue, SW, Washington, D.C. 20250-9410 or call (202) 720-5964 (voice and TDD). USDA is an equal opportunity provider and employer.
|
