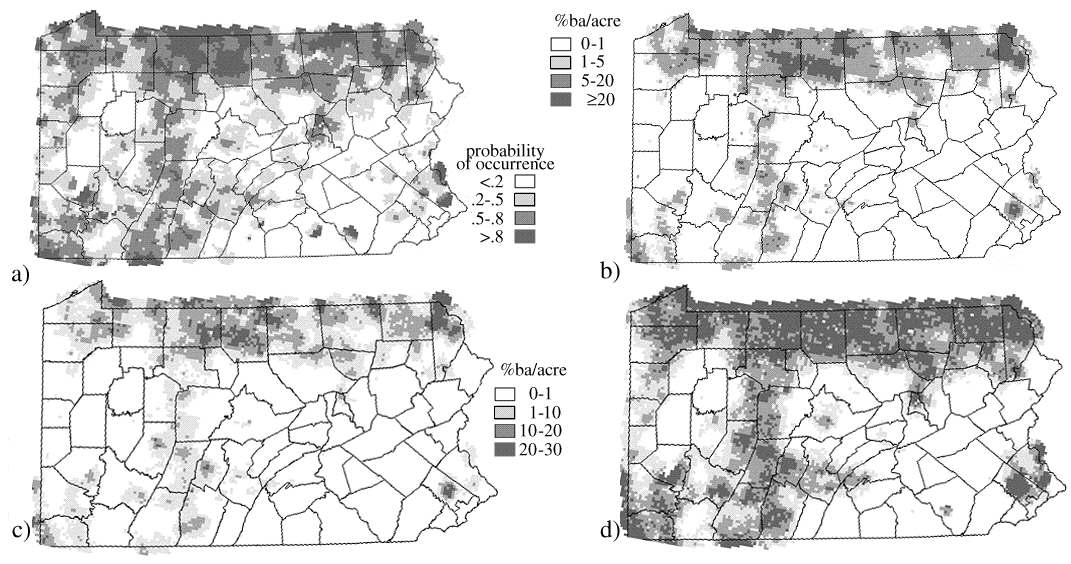
Figure 2. Four estimated datasets describing the distribution of beech in Pennsylvania: a) the estimated probability of occurrence using indicator kriging, b) the median values from 100 sequential gaussian conditional simulations, c) the minus variation (median-17th percentile) and, d) the plus variation (83rd-median) about the median estimate.