Summary Change Maps for Osage-orange

Model Reliability: Medium

Maps depicting changes in habitat quality (represented as Importance Values) and the difference between the modeled habitats for three general circulation models (CCSM4, GFDL-CM3, and HadGEM2-ES) under two representative concentration pathways (RCP 4.5 and 8.5). The averages among the three GCMs are also provided.

Current Forest Inventory & Analysis
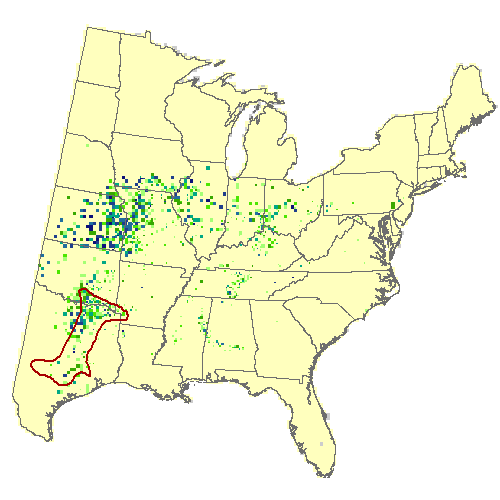
Current Forest Inventory and Analysis for Osage-orange

Modeled Habitat

Modeled Habitat for Osage-orange

Legend

Legend

Community Climate System Model 4.0 (CCSM4)

Moderate emissions (RCP 4.5)

Community Climate System Model 4.0 (CCSM4), Moderate emissions (RCP 4.5) for Osage-orange

Community Climate System Model 4.0 (CCSM4)

High emissions (RCP 8.5)

Community Climate System Model 4.0 (CCSM4), Moderate emissions (RCP 8.5) for Osage-orange
 

Geophysical Fluid Dynamics Laboratory (GFDL)

Moderate emissions (RCP 4.5)

Geophysical Fluid Dynamics Laboratory (GFDL), Moderate emissions (RCP 4.5) for Osage-orange

Geophysical Fluid Dynamics Laboratory (GFDL)

High emissions (RCP 8.5)

Geophysical Fluid Dynamics Laboratory (GFDL), Moderate emissions (RCP 8.5) for Osage-orange
 

HadGEM2-ES

Moderate emissions (RCP 4.5)

HadGEM2-ES, Moderate emissions (RCP 4.5) for Osage-orange

HadGEM2-ES

High emissions (RCP 8.5)

HadGEM2-ES, Moderate emissions (RCP 8.5) for Osage-orange
 

Average of 3 GCM

Moderate emissions (RCP 4.5)

Average of 3 GCM, Moderate emissions (RCP 4.5) for Osage-orange

Average of 3 GCM

High emissions (RCP 8.5)

Average of 3 GCM, Moderate emissions (RCP 8.5) for Osage-orange