
Figure 5—Use this graph to estimate the speed needed to
produce the longest line of water at various coverage levels.
Table
3—Foam tests producing the longest line at various coverage
levels.
| Coverage Level (gal/100 sq. ft) |
Airspeed (knots) |
Line Length (feet) |
| 0.5 |
58 |
210 |
| 1 |
31 |
118 |
| 2 |
31 |
66 |
| 3 |
31 |
46 |
| 4 |
0 |
0 |
| 6 |
0 |
0 |
| 8 |
0 |
0 |
| 10 |
0 |
0 |
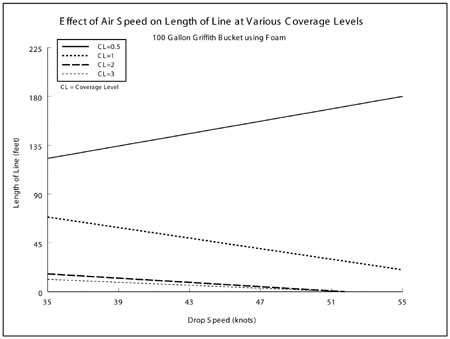
Figure 6—Use this graph to estimate the speed needed to
produce the longest line of foam at various coverage levels.
Table
4—Gum-thickened retardant tests producing the longest
line at various coverage levels.
| Coverage Level (gal/100 sq. ft) |
Airspeed (knots) |
Line Length (feet) |
|
0.5 |
48 |
214 |
| 1 |
48 |
145 |
| 2 |
37 |
32 |
| 3 |
37 |
2 |
| 4 |
0 |
0 |
| 6 |
0 |
0 |
| 8 |
0 |
0 |
| 10 |
0 |
0 |