
Back | Next | Home
Missoula Technology &
Development Center
|
Table
of Contents | Glossary Back | Next | Home |
Missoula Technology & Development Center |
Estimating Methods, Variability, and Sampling for Drop-Test Data

Ordinary kriging is a weighted linear combination of the observed data. The weights are based on a model called the variogram. The variogram is the variance of the difference between two cups at the distance between the two cups. Through modeling, kriging attempts to minimize the prediction error variance to produce an unbiased estimate (Isaaks and Srivastava 1989). Because the findings showed that triangulation was the best prediction method, ordinary kriging was not used.
The Delaunay triangulation method that was used is a weighted linear combination. The result is that closer points receive more weight. Delaunay triangulation uses polygons to determine triangles. In figure 6, the known points are points 1, 2, and 3. The unknown point is V. Point 1 is weighted from area 1, which is the area of the largest triangle. This gives point 1 the most weight, because it is the closest point. Figure 7 illustrates the triangles generated from drop 201.

Figure 6—Three triangles constructed to estimate an unknown point.
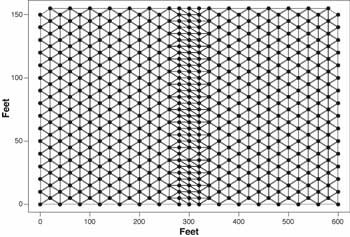
Figure 7—Triangles constructed from sample points.
Triangulation was used to estimate gpc values between observed points. Plotting the estimated points with the observed points created the 10- by 5-foot grid in figure 8.

Figure 8—Contour plot redrawn after triangulated gpc values were
added to observed gpc values.
The contour plot generated by computer software was overlaid as in figure 8. Once the triangulation was complete, an algorithm was used to calculate line length.
Lengths of retardant line at different coverage levels are calculated by searching crossrange rows for values above a threshold. Line segments begin at the point of the first downrange value above the threshold and end at the point of the last value. The points immediately uprange and downrange of the starting and ending points are used to perform a linear interpolation between the two. This technique allows reporting lengths with accuracy greater than the grid spacing. Lengths for each coverage level of interest are reported as both longest continuous segment and total length. This provides an indication of overall continuity of the line. Uncertainty in coverage level is applied as a single estimated value to all points when checking for the threshold condition. A coverage level value of 3.98 will be at the threshold of 4.00 if the estimated uncertainty is 0.02.
| Back | Next Table of Contents Glossary Cover Page |
Missoula Technology & Development Center |