Airtanker Drop Guides
|
Airtanker Drop Guides |
|
| Ground
Pattern Performance of the |
||||||||||||||||||||||||||||||||||||||||||||||||||||||||||||||
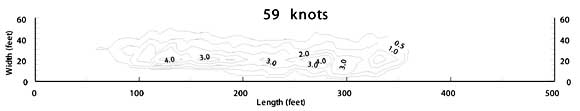
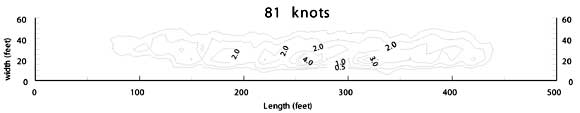
| Tests covered airspeeds from 19 to 89 knots (22 to 102 mph). Drop heights ranged from 25 to 120 feet from the bottom of the helibucket to the ground. The drops were made with three different materials: water, foam and gum-thickened retardant. Drop height and airspeed both have an effect on the drop pattern. Increasing drop height gradually widens the drop at the expense of higher coverage. This effect is modified by the ambient wind. Increasing wind speed widens the drop and decreases coverage levels. Airspeed has a much greater effect on the drop pattern. Figure 2, Figure 3, and Figure 4 show the effect of increasing the airspeed from 19 to 81 knots (22 to 93 mph). Drop heights are nearly identical, ranging from 42 to 47 feet.
The proper amount of retardant (expressed as coverage level in gallons per 100 square feet) differs depending on the fuel model. Table 1 shows the coverage needed for specific fuel models using both the National Fire Danger Rating System and Fire Behavior Fuel Model. Table 1—Retardant coverage levels needed for specific fuel models.
The results of drop tests allow managers to estimate the air speed and height that provide the retardant coverage level required for a given fire intensity. Figure 5 or Table 2 can be used to estimate the air speed of a water drop to obtain the longest line of the desired coverage level. Figure 6 or Table 3 can be used to estimate the airspeed of a foam drop to obtain the longest line of the desired coverage level. Figure 7 or Table 4 can be used to estimate the air speed of a gum-thickened retardant drop to obtain the longest line of the desired coverage level. The line length graphs predict line length (in feet) as a function of airspeed (in knots). The tables are constructed by selecting the drop producing the longest line (on the ground) at each coverage level. Either the graphs or tables may be used to estimate the airspeed required to produce the longest line for a given coverage level. The tables show an ideal case, while the graphs represent an average case.
|
||||||||||||||||||||||||||||||||||||||||||||||||||||||||||||||
|
|
|
| Top Previous | Continue Opening Page |
|