- home -
History of the Cup-and-Grid Method
Some of the first drop tests were conducted between 1955 and 1959 in California by the Pacific Southwest Forest and Range Experiment Station and the California Air Attack Coordinating Committee (Davis 1959). These tests were designed to answer six main questions.
- Does retardant viscosity affect drop behavior?
- Does retardant weight affect drop behavior?
- Do borate and bentonite have the same drop characteristics?
- How do airtanker height and speed affect the drop?
- How large should the gate be?
- Which is more important, airtanker carrying capacity or maneuverability?
 |
| Figure 7ŚPaper cups being collected from the test grid. ŚPhoto courtesy of California Department of Forestry and Fire Protection. The fact that the California Department of Forestry and Fire Protection provided a photograph for this publication in no way implies the DepartmentÆs endorsement of any theories or positions taken with this document. |
These early tests determined that:
- Increased viscosity reduces drift.
- Increasing the drop height increases the coverage area.
- Fall speed and drift are not increased by higher fluid weights.
- Borate and bentonite drop alike.
- Drift increases with both height and speed.
Also during 1967 in Alberta, Canada, a University of Montana graduate student conducted a cup and grid test as part of his masterÆs thesis. Joseph Grigel used a Snow Commander airtanker with a 250-gallon tank to drop Gelgard F, a short-term fire retardant, over an array of cups laid out in a grid format on the ground. Grigel went into more detail regarding methods and design. The objectives of the study as outlined by Grigel were to determine:
- The ground distribution patterns of Gelgard F retardant mixtures released from the Snow Commander airtanker onto an open area and a mature, well-stocked lodgepole-pine stand.
- The effect of release height and mixture viscosity on ground distribution patterns formed by Gelgard F retardant.
- The effect of tree canopy on the ground distribution patterns and recovery rates or the estimated amount of liquid that landed on the ground.
 |
| Figure 8ŚDiagram of GrigelÆs test grid. ŚCourtesy of Joseph Grigel. |
Grigel concluded that ground patterns were determined by height, speed, volume, gating system (as it contributes to flow rate), retardant properties, weather, and fuel or vegetation. A grid-within-a-grid layout was used. The inner grid consisted of cups spaced 7.5 feet apart, covering a 270- by 82.5-foot area (figure 8). An outer grid was built around the inner grid with 10- by 10-foot spacing. The outer grid was to catch any retardant that missed the inner grid. The entire grid, including the inner and outer portions, measured 350 by 142.5 feet (figure 9).
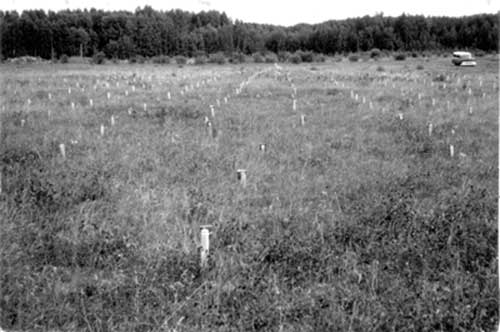 |
| Figure 9ŚGrigelÆs test grid set up in an open field. ŚPhoto courtesy of Joseph Grigel. |
It was assumed that each cup on the grid would represent one-half the distance to the adjacent containers. Linear interpolation was used to estimate points. Grigel noted some principal sources of error:
- Evaporation of water in the cup before weighing.
- Variation in the cup lid weights.
- Cup and can missing or not mounted vertically during the drop.
- Splashing of drop material.
- Human error.
 |
| Figure 10ŚDiagram of George and BlakelyÆs test grid. |
- What is the accuracy or variation for a particular grid point?
- Is the overall grid spacing and sampling adequate?
 |
| Figure 11ŚTable of nine cups for measuring variation around a single sample point. |
The grid system was evaluated by plotting the observed mean concentration in gpc from the inner grid area against the observed mean concentrations from the table data. The observations were found to be highly correlated. Proportioning points for prediction purposes produced an error of less than ▒0.5 gpc. Variation was examined by plotting the standard deviation for the table concentrations against the mean gpc for each table. Levels up to 3 gpc would result in a standard deviation of 0.2 gpc or less.
D. H. Swanson and A. D. Luedecke used ground patterns in their 1978 paper, Tank Design Guide for Fire Retardant Aircraft, to compare the effects of different factors on the drop. Ground patterns obtained from the cup-and-grid method along with film showed that the most efficient drop occurs when the majority of the retardantÆs forward momentum has stopped before the retardant reaches the ground. These findings helped determine the proper drop height (figure 12).
 |
| Figure 12ŚAn example of retardant reaching the ground before forward momentum has stopped. |
In the 1990Æs the Forest Service conducted an extensive series of drop tests on a wide variety of retardant delivery systems. The systems tested included a number of helitankers and multiengine and single-engine fixed-wing airtankers. Drop-test data from each system were assembled into drop-test data books.
 |
| Figure 13ŚA 600-foot test grid from a 1999 drop test. |
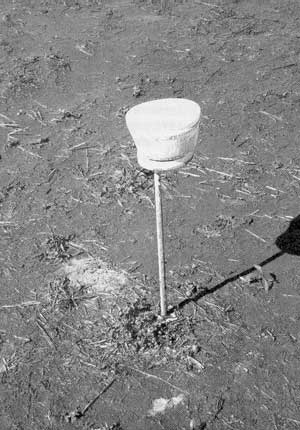
For these tests, cups were mounted on stakes at 10- by 10-foot intervals for the inner grid and up to 60- by 20-foot intervals for the outer grid. Grid size ranged from 250 by 600 feet up to 250 by 3,000 feet, depending on the volume dropped (figure 13).
 |
| Figure 14ŚFoam dropped on the test grid. |
Aircraft drop height and drop speed were measured using video analysis, a global positioning system (gps), and a radar altimeter. Video proved to be the most accurate and reliable. Four liquids were used: water, a 0.6-percent foam solution, gum-thickened retardant, and water-like retardant (figures 14 and 15). Flow-rate settings varied depending on the system. For example, the Bambi helibuckets were tested with only one flow-rate setting. Some air-tankers were tested with up to as many as nine selectable flow-rate settings.
 |
| Figure 15ŚRetardant dropped on the test grid. |
Wind speed and direction were measured using a portable weather station adjacent to the drop site. Instrumentation was mounted 20 feet above the ground. The weight of retardant in each cup and the location of each cup within the grid were recorded. Linear interpolation was used to estimate unknown values (values between cups). Contour patterns were made with computer software (figure 16).
 |
| Figure 16ŚDrop pattern characteristics for the Sims 2,000-gallon helibucket with a drop speed of 83 knots and a drop height of 119 feet. |
As with previous drop tests, ground patterns differed depending on aircraft height and speed, type of retardant or suppressant, flow rate, and wind conditions.
Drop testing over a regularly spaced array of cups has allowed researchers to measure the line length, width, and area, and to calculate the coverage level of the ground pattern. This has improved our knowledge of how height, speed, volume, tank geometry, flow rate, meteorological conditions, and retardant properties influence ground patterns. Yet data regarding the accuracy of the cup and grid method are sparse.