
Back | Next | Home
Missoula Technology &
Development Center
|
Table
of Contents | Glossary Back | Next | Home |
Missoula Technology & Development Center |
Estimating Methods, Variability, and Sampling for Drop-Test Data

Figures 9 through 14 show contour plots of the six drops after triangulation. The outer, dark contour represents the lightest coverage level of 0.5 gpc. The inner lined contour indicates one of the heaviest coverage levels, 8 gpc.

Figure 9—Contour plot of drop 201 after triangulation.

Figure 10—Contour plot of drop 202 after triangulation.
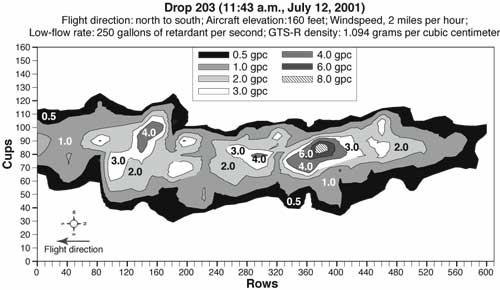
Figure 11—Contour plot of drop 203 after triangulation.
Graphical results continued...
| Back | Next Table of Contents Glossary Cover Page |
Missoula Technology & Development Center |