  |
 |
Technology & Development Center |
| March 2000 | 2500 | 3400 | 0034-2305-MTDC |
Harold Thistle, USDA Forest Service
C. David Whiteman, Pacific Northwest National Laboratory
New technology allows temperature data to be collected and logged in the field inexpensively with small, weatherproof, solid-state data logger/thermistor units. Each of the portable, battery-operated data logger units has a connector that allows it to be connected to the RS-232 port on a laptop computer (Macintosh or PC). Software on the laptop can initialize the data logger or download data from it. The data loggers low unit cost should allow more loggers to be purchased for a given field task, providing better spatial coverage of temperature fields in areas such as forest canopies where horizontal and vertical temperature gradients are of interest. This technology eliminates the need for separate, often expensive and bulky data loggers. The data logger and sensor are in the same unit. The miniature temperature loggers described in this report and various related temperature measurement and logging systems are already being used by Forest Service personnel to monitor stream temperatures, study insect habitat, and evaluate fire environments. This report describes one of the new temperature data logger systems intended for outdoor use. This system was recently tested (Whiteman and others 2000).
Atmospheric temperature is a factor in fire danger, water balance calculations, snowpack stability, insect activity and the viability of forest pathogens, human stress, efficacy of pesticides, dispersion of smoke and pollutants, and many other topics of interest to Forest Service personnel. Temperature fields near the surface of the Earth vary dramatically in many of the environments where Forest Service personnel work. This variability is largely due to the effects of terrain, altitude, location, and forest canopy. Closed canopies tend to be quite uniform in temperature in the lower canopy layers. Broken canopies and the parkland and managed canopies typical of the Western United States can have very complex horizontal temperature patterns that depend on the availability of direct sunlight. Many canopies show sharp vertical temperature gradients near canopy tops as the foliar surfaces progress from shaded to full sunlight. Terrain accounts for variability as slope aspect determines the amount of solar heating. This effect is accentuated with elevation. The thin atmosphere at higher elevations transmits more solar radiation to the foliar surfaces and temperature differences increase between shaded and unshaded areas. Patches of snow accentuate this effect.
It is difficult to obtain representative temperature measurements under many circumstances because of the spatial variability of temperature. This problem could be addressed by taking measurements at many points through the area (or volume) of interest. This approach is not often taken because of the logistics and expense of using many data loggers. Temperature microloggers make dense arrays of temperature measurement much more feasible.
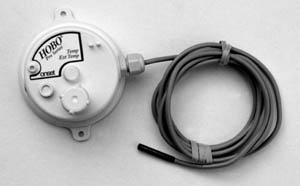 |
| Figure 1-The HOBO H8 Pro Temperature/Temp External temperature data logger. |
The system described and tested in this report is the HOBO H8 Pro Temperature/Temp External Logger developed by Onset Computer of Bourne, MA. Photographs and specifications of this system can be found on the World Wide Web at http://www.onsetcomp.com. The data logging unit, about 4 inches in diameter and 2 inches high (Figure 1), is constructed of white thermoplastic to minimize direct radiative heating. A 6-foot long lead connects the data logger to a thermistor temperature sensor. A radiation shield is needed to properly shield the sensor from direct solar radiation. Direct radiation on the sensor would heat the sensor, producing an unrepresentative air temperature reading. Radiant cooling is also a concern when the sensor is exposed to the open sky at night. A standard unaspirated solar radiation shield is sold separately.
 |
| Figure 2-The radiation shields U-bolts were used to mount the HOBO data logger on a metal fence post. The radiation shield is in the normal operating position. |
Tests were conducted at the Pacific Northwest National Laboratory in Richland, WA, to evaluate:
The sensors accuracy compared to traceable temperature standards
The variability among different sensors
The sensor time constant
The function of the internal clock.
 |
| Figure 3-This graph shows the data loggers temperature relative to a temperature- controlled recirculating bath. The heavy lines represent the manufacturers accuracy specifications. |
These tests are described in detail by Whiteman and others (2000). Accuracy testing was done by comparing temperature readings from five of the HOBO loggers in a stirred temperature bath against a NIST-traceable temperature standard. All five of the temperature sensors remained within 0.26 °C of the standard, well within the manufacturers specified accuracy (Figure 3). Time constant testing was performed by bringing five of the HOBO sensors to equilibrium in a freezer and then placing them at a known temperature outside the freezer. The time constant (Fritschen and Gay 1979) is defined as the time it takes for the sensor to respond to 63.2% of the temperature difference between the two temperature states. The two-channel HOBO H8 has an internal and an external temperature sensor. The external sensors time constant was 122+/- 6 seconds; the time constant of the internal sensor is 557+/- 83 seconds. This is within the manufacturers specifications. By modern standards, these sensors do not respond rapidly to temperature changes. The sensors long time constant provides a built-in means of averaging observations, eliminating the need to make many samples on short time intervals to build up an average. Tests showed that the clocks accuracy was within manufacturers specifications. The clocks lost around 18 seconds per week at room temperature. They gained a few seconds per week when operated at temperatures below freezing.
Field evaluation was performed using a line of temperature data loggers deployed on an open mountainside to study deep temperature inversions that form in Washingtons Columbia Basin. Fifteen of the HOBO temperature data loggers were deployed in this meteorological experiment for a period of 4 winter months. No data were lost because of system failure.
The system is remarkably inexpensive. In early 2000 a two-channel temperature logger costs $169. The optional shuttle costs $159. The software, which can be used with any number of data loggers, costs $95. Radiation shields must be used to properly shield the external temperature sensor (thermistor) from direct sunlight. The manufacturer sells such a shield for $65.
The HOBO Pro and similar measurement and data logging technologies are becoming widely used in the Forest Service. Perhaps the greatest advantage of this technology is the low unit cost that allows more measurements to be made for the same total cost. Whenever lower cost technology is considered, it is critical to know what is being sacrificed in terms of instrument performance. Table 1 shows detailed specifications of the temperature logger. The HOBO H8 Pro performs as advertised and is well suited to making measurements of ambient temperature in settings of interest to the Forest Service. The manufacturer sells other models of temperature data loggers, including miniature data loggers than can be used underwater, loggers that are suitable only for indoor use, loggers with humidity and radiation sensors, and loggers with up to four input channels.
| Characteristic | Specification |
|---|---|
| Number of channels | |
| Operating range (logger) | |
| Time accuracy | |
| Measurement capacity | (one channel at 12-bit and one at 8-bit resolution) |
| Memory | |
| Data offload time | |
| Size | |
| Weight | |
| Battery | |
| Battery life (continuous use) | |
| Storage temperature | |
| External temperature sensor | |
| Response time (still air) | internal sensor, 34 minutes |
| Resolution | less than 0.1 °C over the range 0 to 40 °C |
| Accuracy | better than 0.4 °C over the range from -10 to 50 °C |
Tests of the temperature data logger were made at Pacific Northwest National Laboratory (PNNL) in Richland, WA. PNNL is operated by Battelle Memorial Institute for the U.S. Department of Energy. Reference herein to any specific commercial product, process, or service by trade name, trademark, manufacturer, or otherwise does not necessarily constitute or imply its endorsement, recommendation, or favoring by the United States Government or any agency thereof, or Battelle Memorial Institute. The views or opinions of authors expressed herein do not necessarily state or reflect those of the United States Government or any agency thereof.
Fritschen, L. J.; Gay, L. W. 1979. Environmental instrumentation. New York: Springer-Verlag. 216 p.
Whiteman, C. D.; Hubbe, J. M.; Shaw, W. J. 2000. Evaluation of an inexpensive temperature data logger for meteorological applications. Journal of Atmospheric Oceanic Technology. 17: 77-81.
About the Authors
Harold Thistle received a Ph.D. in plant science specializing in forest meteorology from the University of Connecticut in 1988. He is certified by the American Meteorological Society as a Certified Consulting Meteorologist (CCM), and worked as a consultant in private industry before joining MTDC in 1992. He served as the Centers Program Leader for Forest Health Protection until 1998, developing modeling techniques that accurately describe transport of pesticides in the atmospheric surface layer and evaluating meteorological instrument systems for environ-mental monitoring. He now works with the Forest Health Technology Enterprise Team in Morgantown, WV.
C. David Whiteman is a Staff Scientist at Pacific Northwest National Laboratory in Richland, Washington, where he performs research in mountain and boundary layer meteorology for government and other sponsors. He is a Certified Consulting Meteorologist (CCM), serves the American Meteorological Society as an editor of the Journal of Applied Meteorology, and is an Adjunct Associate Professor at Washington State University.
Additional single copies of this document may be ordered from:
USDA Forest Service
Missoula Technology and Development Center
Building 1, Fort Missoula
Missoula, MT 59804-7294
Phone: (406) 329-3978
Fax: (406) 329-3719
E-mail: /wo_mtdc_pubs@fs.fed.us
For additional technical information, contact Harold Thistle at:
USDA Forest Service FHTET
180 Canfield St.
Morgantown, WV 26505
Phone: (304) 285-1574
E-mail: hthistle/na_mo@fs.fed.us
Lotus Notes: Harold Thistle/NE/USDAFS
The Forest Service, United States Department of Agriculture (USDA), has developed this information for the guidance of its employees, its contractors, and its cooperating Federal and State agencies and is not responsible for the interpretation or use of this information by anyone except its own employees. The use of trade, firm, or corporation names in this document is for the information and convenience of the reader and does not constitute an endorsement by the Department of any product or service to the exclusion of others that may be suitable. The U.S. Department of Agriculture (USDA) prohibits discrimination in all its programs and activities on the basis of race, color, national origin, age, disability, and where applicable, sex, marital status, familial status, parental status, religion, sexual orientation, genetic information, political beliefs, reprisal, or because all or part of an individual’s income is derived from any public assistance program. (Not all prohibited bases apply to all programs.) Persons with disabilities who require alternative means for communication of program information (Braille, large print, audiotape, etc.) should contact USDA’s TARGET Center at (202) 720-2600 (voice and TDD). To file a complaint of discrimination, write to USDA, Director, Office of Civil Rights, 1400 Independence Avenue, S.W., Washington, D.C. 20250-9410, or call (800) 795-3272 (voice) or (202) 720-6382(TDD). USDA is an equal opportunity provider and employer. |
| Top |
