
Trends and Analysis
The greatest benefit of retrospective studies is that they allow us to see trends that have developed, or have continued, over a long period (17 years, in this case). Instead of making a short-term, knee-jerk reaction to perceived problems, fire managers can rely on retrospective studies to identify the problems that have recurred, their causal factors, and the mitigation measures needed to resolve them.
Overall, fatalities increased during the most recent period compared to the initial period. The 137 fatalities during the initial period represent an average of 15.2 fatalities per year. The 173 fatalities during the most recent period represent an average of 21.6 fatalities per year, a 42-percent increase in the annual average. Although burnover fatalities dropped, increases in other causes of death contributed to the overall increase in fatalities. While the average number of fires per year decreased about 5 percent during the most recent period, the average number of acres burned each year increased by 91 percent.
Aircraft accidents are the leading cause of fatalities during wildland fire operations. Aircraft accidents accounted for a total of 72 fatalities, (4.2 fatalities per year), about 23 percent of all fatalities. Fatalities increased from 33 (3.7 fatalities per year) during the initial period to 39 (4.9 fatalities per year) during the most recent period. The increase may be related to the number of acres burned during the period. Several fixed-wing, multiengine airtankers crashed during this period, resulting in a temporary shutdown of fixed-wing, multiengine airtanker operations and later a reduction in the number of fixed-wing, multiengine airtankers being used. This reduction led to an increase in the use of SEATs and Type 1 helitankers. Four SEAT crashes with fatalities occurred during the most recent period.
Vehicle accidents (figure 14) also were a leading cause of death, killing 71 persons (23 percent of the total fatalities), an average of 4.2 fatalities per year. Vehicle accident fatalities increased from 25 during the initial period (2.8 fatalities per year) to 46 during the most recent period (5.8 fatalities per year), a 107-percent increase in the annual average. Most vehicle accident fatalities involved a single individual. Many of the victims were driving to an incident or were returning home after being demobilized.
Because the time of accidents is not reported in the "Safety Gram," it is not possible to evaluate the effect of darkness and/or fatigue. Rollovers were a recurring factor. Several reports documented firefighters being thrown out of their fire apparatus and being run over by the vehicle.
Volunteer firefighters suffered the most vehicle accident fatalities (40), 56 percent of the total. This percentage may be attributed to the large number of volunteer vehicles that respond to wildland fires across the country.
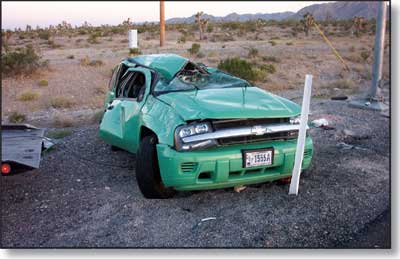
Figure 14—Pay attention to speed, seat belts, and fatigue
to avoid being
injured or killed in a vehicle accident.
Heart attacks continue to be a leading cause of death among wildland firefighters (22 percent of the total fatalities). The number of heart attacks increased from 29 during the initial period (3.2 fatalities per year) to 39 during the most recent period (4.9 fatalities per year), a 51-percent increase in the annual average.
Among Federal and State firefighters, heart attacks increased from 7 during the initial period (0.8 fatalities per year) to 12 during the most recent period (1.5 fatalities per year), an 88-percent increase in the annual average. From 1998 to 2004, four Federal, three State, and two volunteer firefighters died from heart attacks while taking the Work Capacity Test or training to do so. No one died during 2005 or 2006, the period during which Federal firefighters were required to undergo improved health screening before taking the Work Capacity Test. The brochure, "Work Capacity Testing for Wildland Firefighters: Promoting Wildland Firefighter Safety" (figure 15), is available at http://www.fs.fed.us/fire/safety/wct/2002/brochure_2002.pdf.
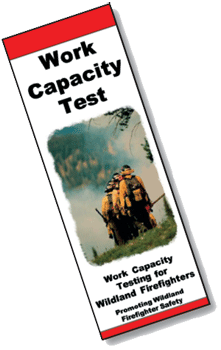
Figure 15—The Work Capacity Test
(sometimes called the pack test) helps
ensure that firefighters are fit for their jobs.
The NWCG defines a burnover as "…a situation where personnel or equipment is caught in an advancing flame front." Burnovers (figure 16) are the most visible cause of death for wildland firefighters, but they caused only 64 (21 percent, or an average of 3.8 fatalities per year) of the total (310) fatalities. Four burnovers were responsible for nearly half (29) of the 64 fatalities:
- Dude Fire in Arizona (1990)—6 fatalities
- South Canyon Fire in Colorado (1994)—14 fatalities
- Thirtymile Fire in Washington (2001)—4 fatalities
- Esperanza Fire in California (2006)—5 fatalities
The first three major burnover fatality events (Dude, South Canyon, and Thirtymile Fires) led to significant changes in the way wildland fire suppression efforts are undertaken. If we remove these three events and the 2006 Esperanza burnover from consideration (for a total of 29 fatalities), the average number of burnover fatalities drops to a base level of 2.1 burnover fatalities per year.

Figure 16—Burnovers continue to be one of the major
causes of death during
wildland fire operations.
To get a better sense of trends that might be lost by consolidating data, the analysis of burnover fatalities was broken into timeframes that differ from the study periods used elsewhere in this report (figure 17):
- 1990 to 1994—From the Dude Fire (1990) through
calendar year 1994 when the South Canyon Fire occurred.
- 1995 to 2001—After the South Canyon Fire, its
reviews, and subsequent changes in fire operations. This timeframe includes
the four fatalities on the Thirtymile Fire.
- 2002 to 2006—The "Post-Thirtymile" era that includes the five fatalities on the Esperanza Fire.

Figure 17—Burnovers can be grouped based on the changes that
occurred after
the most serious burnovers: the Dude Fire (1990),
the South Canyon Fire
(1994), and the Thirtymile Fire (2001).
Burnovers killed 33 firefighters from 1990 to 1994, an average of 6.6 per year. More than half of those fatalities were on the Dude (6 fatalities) and South Canyon Fires (14 fatalities). Many of those killed during this timeframe were Federal and State firefighters who were suppressing fires that were viewed as direct or indirect threats to private homes and other structures (figure 18).

Figure 18—Protecting homes in the wildland-urban interface has increased
the risk to firefighters. This wildland-urban interface is on Long Island, NY.
After the South Canyon Fire, several reviews, special studies, and conferences focused the attention of wildland firefighters across the United States on the need for safer work practices on the fireline.
From 1995 to 2001, 17 firefighters died in burnovers, an average of 2.4 per year. Both 1996 (6.0 million acres burned) and 2000 (7.4 million acres burned) were significant fire years. In 2001, the Thirtymile Fire killed four firefighters and led to a new round of reviews and policy changes. From 2002 until 2006, an additional 14 firefighters were killed by burnovers, an average of 2.8 per year. During October 2006, five Federal firefighters were killed by a burnover on the Esperanza fire in California.
Although this report documents and analyzes fatalities that occurred during wildland fire operations, close call events that are not as well documented may lead to future fatalities. The "Safety Gram" does document entrapments.
The NWCG defines an entrapment as "…a situation where personnel are unexpectedly caught in a fire behavior-related, life-threatening position where planned escape routes or safety zones are absent, inadequate, or have been compromised. An entrapment may or may not include the deployment of a fire shelter for its intended purpose. These situations may or may not result in injury. They include near misses."
Entrapments were reviewed during the same timeframes as burnover fatalities: 1990–1994; 1995–2001; and 2002–2006. While the number of burnover fatalities decreased after fires with multiple fatalities from burnovers, such as South Canyon (14 fatalities, 1994) or Thirtymile (4 fatalities, 2001), the number of entrapments did not drop. The "Safety Gram" and "Wildland Firefighter Entrapments: 1976–1999" (figure 19), recorded a total of 875 entrapments from 1990 to 2006 (figure 20):
- 1990 to 1994—218 entrapments (43.6 per year)
- 1995 to 2001—414 entrapments (59.1 per year)
- 2002 to 2006—243 entrapments (48.6 per year)
While many of these events did not result in fatalities, they are a harsh reminder of the fine line between a close call and death. They merit our attention.
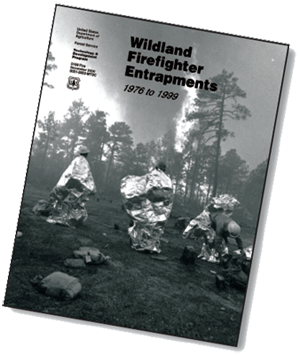
Figure 19—This report is available online at:
http://www.fs.fed.us/t-d/pubs/htmlpubs/htm00512853/
Username: t-d, Password: t-d
—Cover photo by Mark Erickson, Silver City, NM.
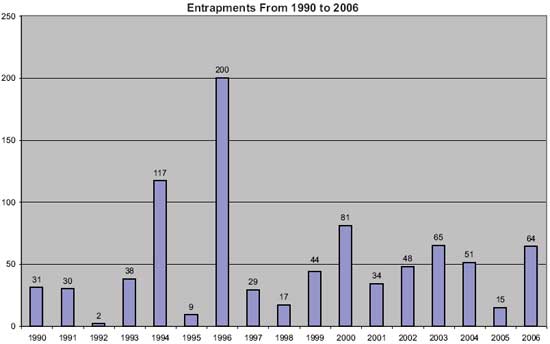
Figure 20—The number of entrapments from 1990 to 2006.
Falling trees/snags and rolling rocks killed 11 firefighters: 5 during the initial period (0.6 per year) and 6 during the most recent period (0.8 per year).
Fatalities from other medical and miscellaneous causes increased from 6 during the initial period (0.7 per year, including 3 from other medical causes and 3 from miscellaneous causes) to 17 during the most recent period (2.1 per year, 6 from other medical causes and 11 from miscellaneous causes). Other medical causes included brain aneurysms, undefined sickness, and heat stress.
The miscellaneous causes included being struck by lightning, electrocution, drowning, and even a murder in a staging area. While the 23 fatalities from other medical and miscellaneous causes include only 7 percent of the total deaths, targeted actions (figure 21), such as training in lightning awareness and powerline dangers, can be taken to reduce the number of fatalities, especially those with nonmedical causes.
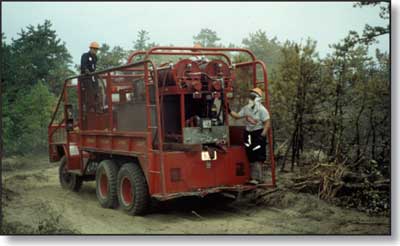
Figure 21—Following safe practices at all times can help reduce fire
fatalities. Riding outside an engine is not a safe practice.