USDA Forest Service Resource Information Group
|
|
|
Plot-GEM Example #3Plot-GEM
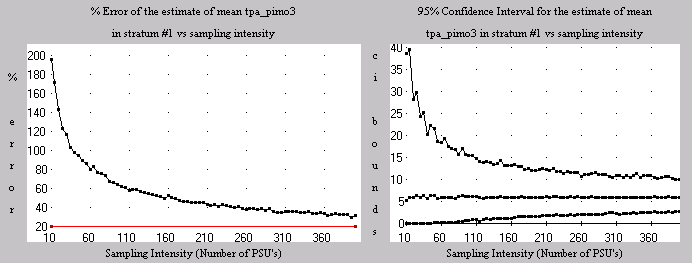
We're collecting a lot of data for many different attributes/variables, which attributes meet our accuracy objectives?In 2000, Region 1 (R1) conducted a pilot study in the Idaho Panhandle National Forest. The study area contained 59 existing FIA primary sampling units (PSUs). R1 intensified this grid such that there were 400 PSUs on a regular grid in the study area. One of the questions R1 wished to answer via the pilot study was "How much of an intensification (if any) of the existing FIA grid will achieve ±20% estimation accuracy?" However, some of the attributes are less variable than others. Thus some attributes can be estimated with great accuracy at low sampling intensities, whereas even at a high sampling intensity other attributes cannot be estimated with any reasonably degree of accuracy. It was important to distinguish the attributes that could be estimated accurately from the ones that could not. Plot-GEM was used to generate the graphs in Figures 3 and 4. Figure 3 shows that mean total live trees per acre is readily estimable with great accuracy. Figure 4 shows that mean live trees per acre of White Pine cannot be accurately estimated.
Even using the existing FIA grid, mean total live trees per acre is estimated with an accuracy of ±9%. However, mean live trees per acre of White Pine cannot be estimated with an accuracy of ±20% no matter what the sampling intensity. Even at the highest intensity of 400 PSUs, the percent error of the estimate of mean live trees per acre is still ±32%. In this way R1 used Plot-GEM to decide which attributes could be accurately estimated. |
|
|
USDA Forest Service (202) 205-0895
|
|
| NOTE: PDF format links require the Adobe Acrobat Reader to view. | |
| top | Disclaimers | FOIA | Privacy Policy | Quality of Information |

Last modified: Monday, 03-May-2021 17:30:24 CDT
Contact Webmaster: Kris Bancroft