
Rey Farve, Project Leader
Results & StatusFor this technology demonstration deployment and evaluation, we performed a:
- Long-term deployment of the devices in a bat hibernaculum
- Summer deployment of devices at a cave entrance (analysis of data ongoing)
- Laboratory test of the devices’ ability to capture known ultrasonic frequencies (Draft Report)
- Laboratory test of the devices’ ability to capture ultrasonic calls from live bats (analysis of data ongoing)
The following discussion is arranged as follows:
- Winter Deployment (in bat hibernaculum): December 2012 — April 2013
- Equipment & Materials — Detectors and Dataloggers
- SM2BAT+bat detector (by Wildlife Acoustics)
- D500x bat detector (by Pettersson Elecktronic)
- AnaBat Roost Logger (by Titley Scientific)
- Bat Datalogger II (by Tony Messina)
- Methods — Processing recorded data from detectors and dataloggers
- Manual processing of bat detector files and AnaBat Roost Logger files
- Bat Logger II output
- Comparison of Total Calls recorded devices
- Detectors versus datalogger comparison
- Device–by–device comparison
- Summer Deployment (at cave entrance): June — September 2013
- <<Analysis currently ongoing>>
- Laboratory Testing of Devices
- Objective of Laboratory Test
- Materials & Methods
- Results
- Effect of Signal Intensity
- Effect of Angle of Incidence
- Conclusions
- Laboratory Testing of Devices using live bats
- <<Data analysis currently ongoing>>
1. Winter Deployment (in bat hibernaculum): December 2012 – April 2013
In November 2012 the team deployed bat dataloggers and detectors in a bat hibernaculum in Cottonwood cave on the Lincoln National Forest, Guadalupe Ranger District (New Mexico) (figure 4). The devices were co-located, programmed, and powered for a long-term deployment to record bat calls (quantify bat activity); the intent was for the devices to operate until late February 2013 (or longer). To prevent disturbance to hibernating bats, this equipment was deployed in a cave passage (4m wide) between the entrance and the room where the bats were hibernating (not directly in the hibernaculum). This placement allowed for monitoring the activity of bats leaving or entering the hibernaculum in mid–winter.
All devices were retrieved by April 2013.
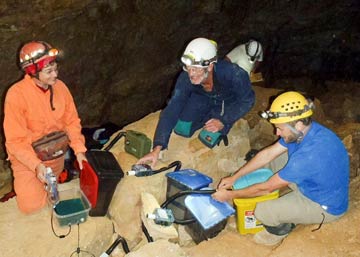
Fig. 4 - Team members deploying bat detectors and datalogging devices in Cottonwood cave on the Lincoln NF. (From left to right: D. Buecher, D. Plummer, and J. Walz. Russ Schneider, the forest fire engine captain, in background.)
A. Equipment – Detectors and Data Loggers
Below is a brief description of the features of the devices. (Also see tables 1a and 1b below for a side-by-side comparison of the equipment.)
1. SM2BAT+ (by Wildlife Acoustics)
The SM2Bat+ is a full spectrum bat detector that uses an omnidirectional, external microphone to record directly to time-stamped WAC (proprietary Wildlife Acoustics Compressed) files. Post–processing allows converting WAC files to WAV files (time–expansion) and zero crossing files using software provided by Wildlife Acoustics. The device has slots for four SDHC (Secure Digital, High–Capacity) memory cards.
This detector stores files composed of bat calls as sequences of individual bat chirps separated by a programmable period of silence.
The SM2Bat+ is typically powered internally with four standard D-cell batteries, but we used two external 12–volt batteries for the long-term deployment.
For the winter deployment, we used a sample rate of 1 hour at: midnight (12 a.m. – 1 a.m.), sunrise, and sunset. (Note: The device can be programmed to the actual time of sunrise and sunset based on the latitude – longitude of the location.) The timer allows for an almost limitless programming schedule.
(Note: Wildlife Acoustics recently (in March 2014) announced the production of a 3rd generation bat detector, the SM3Bat; in the fall of 2014, Wildlife Acoustics introduced a low power (and low cost) zero–crossing only detector, the Song Meter SMZC.)
2. D500x (by Pettersson Electronik)
The D500x is also a full-spectrum ultrasound recording unit that records time-stamped WAV files of call sequences of individual vocalizations. The recorder is equipped with four slots for CF (CompactFlash) memory cards.
The external microphone is directional. The D500x is typically powered internally with four standard AA–size batteries, but we used two external 6–volt batteries for the long–term deployment.
For the winter deployment, we used a sample rate of 2 hours at: “midnight” (12 a.m. – 2 a.m.), “sunrise” (5 a.m. – 7 a.m.); and “sunset” (4:30 p.m. – 6:30 p.m.). (The D500x’s timer allows for programming four on/off periods per day.)
3. AnaBat Roost Logger (by Titley Scientific)
The AnaBat Roost Logger was designed to be used for long–term monitoring of bat activity in enclosed areas (smaller passages in caves or mines) where species identification of bats is not of primary importance. The device was specifically designed to require very low power consumptions and digital memory. The directional microphone is attached to the device’s case and is specifically designed to have low sensitivity so that it detects ultrasonic signals in a small space around the microphone (as might typically occur in roosts or mines).
The roost logger records only a narrow bandwidth and, as such, only renders part of the ultrasonic signal, which makes it of limited use in species identification. The time–stamped files generated off the ultrasonic signals (individual calls) are displayed in AnalookW software as zero–crossing–like files, which provide information on the general range of the ultrasonic frequency. (See more detailed discussion in section B.1, below.)
The Roost Logger is equipped with a slot for one SDHC memory card and powered internally with four standard D–cell batteries, but we used two external 12–volt batteries for the long–term deployment.
For the winter deployment, we used the sampling rate identical to that of the Pettersson’s D500x.
4. Bat Logger II (by Tony Messina)
In about 1998, Tony Messina developed a “Simple Bat Detector”, a frequency division type of detector. Later (in about 2010) he combined this simple bat detector with a datalogger (specifically an Onset HOBO multi-channel datalogger) into a prototype detector/logger that he called the “Bat Logger”. (Tony Messina is a retired electronics engineer who later formed his own company, Nevada Bat Technology, in 2001.)
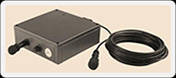
The “Bat Logger II” (Messina’s latest version of the prototype) is unlike any of the other devices we tested; it does not record (store) any digital ultrasound files. Rather, the Bat Logger II quantifies bat activity by counting ultrasonic signal events (which can reasonably be assumed to represent individual bat “chirps”). The unit converts the count of events (or chirps) to a discrete voltage output that accumulates until it is downloaded in the HOBO logger (figure 5). The download interval of the HOBO logger is programed by the user.

Fig. 5 - Diagram of how the Messina Bat Logger II operates — see > http://home.earthlink.net/~bat-detector/Loggers/
An increase in the output voltage indicates an increase in the events/chirps. The chirp counts are stepped semi–logarithmically (using a 1–2–5 progressive sequence) to provide a range of (rather than distinct) counts. (See the discussion in section 1.B.2, below and table 2.) Each time the HOBO samples the output voltage the Bat Logger II zeros and starts a new count. (Note: Other bat researchers [e.g., Nagel and Nagel 1994 and Parks et al. 1999:420] have developed and used dataloggers to monitor bat activity.)
The output of data files shows date, time, and number of calls/events on an Excel spreadsheet. (See more detailed discussion of data output from the Bat Logger II in section 1.B, below.)
The Bat Logger II was designed specifically for long–term monitoring of bats in caves, roosts, and mines. The device is designed to be powered externally with a 12–volt battery. We used two 12–volt batteries to power the devices during the long–term deployment. We programed the Bat Logger II to recorded data continuously (at 15 minute intervals) for the entire winter.
Availability of Bat Logger II.
The Bat Logger II was never commercially available; Messina, however, freely provided detailed, step–by–step circuit board construction instructions over the Internet for those interested in building a device. Messina had also, on occasion, built several devices (at cost) for several bat researchers. Since 2010, about 50 devices have been deployed to monitor bat activity – mostly in the southwest U.S.
(Note: For this project we purchased a Bat Logger II from Messina and built a second device (from scratch) using the instructions that Messina has provided.)
With Onset’s discontinuance of the series of HOBO dataloggers used in the Bat Logger II, no new Bat Logger IIs (as currently configured) are constructible. Messina is, however, currently working on developing a 3rd version of his device which he calls “The Bat Call Data Recorder”. This new version is being designed without any unique third party supplier parts. (Messina 2014; Email message from T. Messina to D. Plummer on 16 Sept. 2014.)
Anyone interested in the progress/status of Tony Messina’s lasteest prototype device is encouraged to contact him at: t-rex@ix.netcom.com or visit his website at http://home.earthlink.net/~bat-detector/Loggers/BCDRec.html.
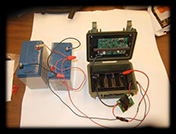
Below are photos (figures 6 and 7) that show how the detectors and dataloggers were powered for the long–term deployment.
 |
 |
| SM2Bat+ (by Wildlife Acoustics, Inc.) | |
 |
 |
| D500X (by Pettersson Elektronik) | |
| Fig. 6 (a–d) – Bat Detectors (left); Devices wired for long–term deployment (right). | |
 |
 |
| AnaBat Roost Logger (by Titley) | |
 |
 |
| Bat Logger II (by Tony Messina) | |
Fig. 7 (a–d). –Bat Dataloggers (left); Devices wired for long-term deployment (right).
Figure 8 below is a diagram of how the devices were wired to external batteries (including a battery saver) for the long-term deployment.

Fig 8. – Wiring diagram showing linkage to the battery saver and the external battery.
Tables 1a and 1b provides a comparison of the equipment used and their performance during equipment deployment. For deployments, the SM2Bat+ was packaged inside a Tupperware (plastic) container box and the D500x was deployed inside a pelican box. The two dataloggers (AnaBat Roost Logger and Bat Logger II) did not need any additional protection from the cave elements. We used protective containers for all of the external batteries.
We programed the sampling rate (and supplied storage/memory cards) to allow for a deployment of several months. All devices operated from December through February. When we retrieved the devices from the long-term deployment (in April), all devices were still in good condition.
The dataloggers and the Pettersson D500X remained powered until late April. Although the Wildlife Acoustic’s SM2Bat+ device exhausted its power supply the earliest (i.e., late February) it recorded almost as many files as the other devices in the shorter duration and with a smaller sampling rate.
| Device Type | Brand Name | Cost | Ease of Programming | Memory Storage | Microphone Type | Measured Current Draws | External Power (battery size) |
|---|---|---|---|---|---|---|---|
| Detector | Pettersson’s D500X |
$2400 | Semi– programmable |
4 CF card slots | Directional | Active=0.4 Idle=0.04 Sleep=0.009 |
2–6v; 36 amp-hr |
| SM2Bat+ | $1500 | Totally Flexible Programming | 4 SDHC card slots | Omni- directional |
Active=0.24 Idle=0.01 Sleep=0.009 |
2–12v; 26 amp-hr |
|
| Data Logger | AnaBat Roost Logger | $400 | Semi - programmable (difficult) | 1 SDHC card slot | Directional | Active=0.008 Idle=0.001 |
2–6v 36 amp– hr |
| Bat Logger II | $300 | Limited Programming (Hobo logger) | N/A1 | Directional | Active=0.023 | 2-6v 26 amp– hr |
|
| 1The Messina Bat Logger II does not record or store sound data; it only logs ultrasonic events using a HOBO Logger. The Logger has a storage capacity for 64KB that allows storage of over 43,000 events. | |||||||
| 2Current drawn (in amperes) (actually measured) by device while actively recording, while idle, and while in sleep mode. | |||||||
| Device Type | Brand Name | Sampling Rate | Days devices operated (from Dec. 1) | Equipment Condition | Quantity of Data (# of files generated) | Quality of Data | Species Detection Ability* |
|---|---|---|---|---|---|---|---|
| Detector | Pettersson’s D500X |
2hrs at: sunset, midnight, sunrise |
144 (until April 23) |
Very Good | 1916 | <TDB> | <TDB> |
| SM2Bat+ | 1hr at: sunset, midnight, sunrise |
90 (until Feb 28) |
Very Good | 1490 | <TDB> | <TDB> | |
| Data Logger | AnaBat Roost Logger | 2hrs at: sunset, midnight, sunrise |
143 (until April 22) |
Very Good | 2265 | <TDB> | very limited |
| Bat Logger II | Constantly at 15 minute intervals | 160 (until May 9) |
Very Good | 15,300 | <TDB> | none | |
| *Especially the devices’ ability to detect calls of bat species with "loud" versus “quiet" (low intensity) calls. | |||||||
Device Configuration
The devices were configured as follows:
- SM2Bat+: Sample Rate= 384000; Channels– Mono–L; File Format– WAC0; Gain left– +0.0 dB; Gain right– +0.0 dB.
- D500x: f=500; PRE=OFF; LEN=1.0; Input Gain=45; Trig Lev=80; Interval=0.
- AnaBat Roost Logger: battery capacity entered as 1300AH.
- Bat Logger II: Sensitivity potentiometer in middle position. Data logger scaling: 0.0119 = 0.0; 0.35897 = 15.0.
As mentioned previously in the Plan of Action, the intent of the deployment is to demonstrate whether (or not) bat dataloggers can be an autonomous (unattended), cost-effective tool to accurately monitor bat activity over long periods (i.e., months) in cave and mine roosts.
As such, we compared the datalogger’s ability to record ultrasonic signals against the performance of bat detectors. (Since bat detectors are the tool–of–choice for passive bioacoustics monitoring of bats, we considered the bat detector’s results as the standard measure of the ultrasonic signals.)
The analysis discussed in this section is based on the total number of calls that were recorded by each device. The focus of the analysis is on comparing bat dataloggers against bat detectors and not a comparison of bat detectors.
1. Manual processing of bat detector files and AnaBat Roost Logger files
We manually examined each file generated during December 2012 through February 2013 on the Pettersson D500X, Wildlife Acoustics SM2BAT+, and AnaBat Roost Logger. We used Wildlife Acoustic’s Song Scope software to view the files (sonograms) generated by the two bat detectors (i.e., full–spectrum calls). We used AnaLookW software (by Titley Scientific) to view data collected on the AnaBat Roost Logger.
We manually counted all calls (individual bat vocalizations in the 20–80kHz range) that were identifiable on the sonogram, regardless of call quality or completeness. Any unusual noise that did not resemble a typical bat call (e.g., as reported by Fenton & Bell 1981: 236 or Szewczak et al. 2011) was noted for later scrutiny. The file number, date, time, and total number of calls were recorded on Excel spreadsheets. (Note: all ultrasonic files pertaining to the project are kept with the National Technology and Development Center Project Leader’s project files.)
Below are examples of sonograms from the D500x and SM2Bat+ full–spectrum detectors that show how signals were identified for counting (figure 9).

Fig 9. – Screenshots of typical sonograms (using Song Scope software). The top sonogram shows a total of three calls recorded by the Pettersson D500x; the bottom sonogram shows four calls recorded by the SM2Bat+ (by Wildlife Acoustics).
We viewed files recorded by the AnaBat Roost Logger using AnaLookW software. A typical sonogram from one of the files is shown below (figure 10.) As previously mentioned the Roost Logger records only a narrow bandwidth and, as such, only renders part of the ultrasonic signal that was emitted by the bat.

Fig 10. – Screenshot of a typical call file recorded by AnaBat Roost Logger. We would have counted this file as having a total of 10 calls (i.e., bat vocalizations).
2. Bat Logger II data output
As mentioned in section 1.A.3 above, Messina’s Bat Logger II reports the number of calls on an Excel spreadsheet, and, as such, there are no calls to count. Rather than recording individual sound files, the Bat Logger II sampled bat “chirps’ in 15–minute intervals. For each interval, the number of calls was logged in terms of a “level,” or “step,” where each step represents approximately double the number of calls of the previous step, following a 1–2–5 progressive sequence (table 2).
As a result, the number of calls corresponding to the step recorded by the Bat Logger II represents the minimum number of calls (see table 2, 2nd column) for that 15–minute interval. For example, if the Bat Logger II recorded a step 5 during a certain interval, it means that, during that 15–minute window, enough calls were recorded to reach the threshold of step 5 (at least 10 calls), but not enough to reach step 6 (at least 20 calls).
We decided to use an average of the minimum and maximum calls (events) for each step (see table 2, 4th column) (and not the minimum number of calls) to provide a fairer comparison of the Bat Logger II against the other devices.
| Number of Events/Calls | |||
|---|---|---|---|
| Step | Minimum | Maximum | Average* |
| 1 | 0 | 0 | 0 |
| 2 | 1 | 1 | 1 |
| 3 | 2 | 4 | 3 |
| 4 | 5 | 9 | 7 |
| 5 | 10 | 19 | 14.5 |
| 6 | 20 | 59 | 34.5 |
| 7 | 50 | 99 | 74.5 |
| 8 | 100 | 199 | 149.5 |
| 9 | 200 | 499 | 349.5 |
| 10 | 500 | 999 | 749.5 |
| 11 | 1000 | 1999 | 1499.5 |
| *A midpoint (average) between the maximum and mimimum values was used as the number of calls for this analysis (See discussion in Section 1.B.2 above.) | |||
C. Comparison of Total Number of Calls recorded on devices
This section provides a comparison of the total number of calls that were recorded on the devices tested during the winter deployment in a bat hibernaculum. We provide a general comparison of the bat detectors versus bat dataloggers in section 1.C.1 and a comparison of individual detectors versus individual dataloggers (device–by–device comparison) in section 1.C.2.
(Note: The data generated during the summer deployment of 2013 is still being analyzed and will be reported in future updates to the Web site in section 2, below.)
1. Detectors versus Dataloggers comparison
The comparison of the detectors versus the dataloggers is based on a review of the total number of calls recorded on the detectors versus the dataloggers (by month and time of day). We provide a series of charts (bar graphs) that compare devices at the Charts & Tables link.
Below (figure 11) is an example of a few of the charts provided. These charts (below) are of 3 weeks in December 2012, showing total number of calls recorded on devices during the 2 hour “midnight” period (i.e., 12:00 a.m.–2:00 a.m.).

Fig 11. – . Sample of a few charts that compare the total number of calls recorded by bat detectors versus dataloggers evaluated in this study. (For a pdf version of all charts see Charts & Tables link.)
From even a cursory review of data in the charts, the following is obvious:
- The co-located devices did not collect ultrasound data identically or even similarly. (See more detailed discussion in section 3 – Lab Testing of Devices)
- A comparison of the total number of calls collected by the bat detectors versus the bat dataloggers reveals no obvious correlations between the two types of devices.
- The AnaBat Roost Logger consistently recorded the fewest number of calls during the winter deployment.
- In general, bat detectors recorded moe calls that bat data loggers.
2. Device–by–device Comparison
We compared the devices against each other to determine if any statistical differences or correlations were evident. Since the SM2Bat+ recorded only during the first hour of deployment, we only used the total number of calls recorded on devices in the first hour (of all months) for this comparison.
The number of calls recorded at sunset was not significantly different for the two bat detectors (Wildlife Acoustics’s SM2Bat+ and Pettersson’s D500x). During sunrise and midnight there was no significant difference in the total number of calls recorded by the data loggers (Messinna’s Bat Logger II and Anabat). All of the devices during all other time periods differed significantly in the total number of calls they collected (table 3).
| Dec. 2012 — Feb. 2013 | |||
|---|---|---|---|
| Devices Compared | Sunrise | Sunset | Midnight |
| Pettersson v. AnaBat | yes* | yes | yes |
| Pettersson v. Messina | yes | yes | yes |
| Pettersson v. Wildlife Acoustics | yes | no | yes |
| Wildlife Acoustics v. AnaBat | yes | yes | yes |
| Wildlife Acoustics v. Messina | yes | yes | yes |
| Messina v. AnaBat | no | yes | no |
| *Yes = significant difference, if p - value < 0.05. Significance test is based on Poisson Distribution, Comparison of Means. | |||
The same data used for the significant difference analysis (above) was used to determine if any correlations were evident between devices (table 4). The two bat detectors were correlated in their ability to capture calls during all time periods. The correlations between all other devices were either weak or mild.
| Dec. 2012 — Feb. 2013 | |||
|---|---|---|---|
| Devices Compared | Sunrise | Sunset | Midnight |
| Pettersson v. AnaBat | mild | weak | mild |
| Pettersson v. Messina | weak | weak | weak |
| Pettersson v. Wildlife Acoustics | strong | strong | strong |
| Wildlife Acoustics v. AnaBat | mild | weak | mild |
| Wildlife Acoustics v. Messina | weak | weak | mild |
| Messina v. AnaBat | mild | mild | mild |
| Strong = correlation coefficient > 0.6; mild = correlation coefficient between 0.6 – 0.4; weak = correlation coefficient < 0.4 | |||
2. Summer Deployment (at cave entrance): June – September 2013
Analysis currently ongoing
3. Laboratory Testing of Devices’ Ability to Capture Known Ultrasonic Frequencies
Below is a summary of the results of the lab study. A detailed description of the lab test and discussion of the results is available at Draft Report – Laboratory Testing of Devices’ Ability to Capture Known Ultrasonic Frequencies.
As mentioned previously (section 1.C.1, above), during analysis of data collected during the winter deployment, we noticed that the co–located devices did not collect ultrasound data identically or even similarly. Even a casual examination of a minute–by–minute comparison of the number of files generated (and the number of calls recorded) reveals wide discrepancies, not only between detectors and dataloggers, but also between the detectors themselves.
We conducted a literature review to determine if other researches had experienced similar discrepancies in bat detectors signal detecting abilities. Several investigators have reported that detectors had different sensitivities that can lead to differences in signal detection cone, angular range of detection, and maximum detection distances. (See more detailed discussion in the Draft Report.)
Given the discrepancies that we observed in the signal detecting ability among devices, we decided to verify this phenomenon by testing the signal detecting abilities of the detectors and dataloggers under laboratory (controlled) conditions.
A. Objective of Laboratory Test
The objective of the lab study was to document the ultrasonic signal detecting abilities of the four devices (evaluated for this project) under controlled conditions through the use of known ultrasonic frequencies, at known amplitudes, and at various angles to the microphone.
B. Materials and Methods
Dave Plummer (electronics technician) and Ted Etter (electronics engineer) performed the laboratory test (discussed below) at the National Technology &: Development Center, Missoula, MT, photography studio.
In order to test each device under identical conditions we created a circuit and software for generating and controlling ultrasound signals (figure 12).
More details of the materials and methods are provided in the Draft Report.

Fig 12. – Circuit boards for the Ultrasonic Signal Source (top). Function generator and oscilloscope used to generate and view ultrasonic signals of specific frequencies and amplitudes (bottom).
In the laboratory test we had the ability to control the duration, amplitude (intensity), and frequency of synthetically generated ultrasound signals. We pulsed 10 signals at 12 frequencies (i.e., 25, 30, 35 … 80 kHz) through a transducer to each of the four devices. Devices were positioned 4.5 feet from the transducer. We also controlled the angle of incidence (angle between transducer and device) by rotating the device (or its microphone) from head-on (0 degrees), to 45 degrees, and to 90 degrees.
Because the Bat Logger II captures and logs signals differently than the other three devices, we used a timed sequence of emitting the 10 signals to that device to provide for a reasonable comparison with the other devices. (More details of the methods used are provided in the Draft Report.)
The site of the lab test (the Missoula, MT, studio) has foam acoustic panels on much of its wall surfaces. In order to further isolate the devices being tested, we placed the devices in a four–sided (three sides and a ceiling) interview booth lined with acoustic foam panels. The devices were placed on a stand in front of the rear wall of the booth (figure 13).

Fig 13. – Lab setup for testing ultrasonic sensitivity of the device.
In summary, the lab test resulted in a test of each devices’ ability to capture 10 synthetically–generated pulses at: 12 different frequencies (i.e., 25, 30, 35 … 80 kHz), various intensities (high, medium, and low), and various angle of incidences (0 degrees, 45 degrees, 90 degrees).
We manually reviewed the WAVE files recorded on the SM2Bat+ and D500x devices using Cornell University’s Lab of Ornithology sound analysis software, Raven Lite 1.0. We reviewed the AnaBat Roost Logger files on AnalookW software. The Bat Logger II device is designed to use Onset’s HOBOware Pro software for reporting ultrasonic activity.
C. Results
There is a link below to the bar graphs which summarize how all of the devices compared to each other.
1. Effect of Signal Intensity
A top down viewing of the matrix (bar graphs in figure 14) highlights how the devices’ signal detecting abilities compare relative to the intensity of the signals.
A few observations are:
- In general, the higher the signal’s intensity, the more signals that devices detected.
- Detectors tended to outperform dataloggers
2. Effect of Angle of Incidence
A horizontal viewing (across) of the matrix (bar graphs in figure 14) focuses on the devices’ differing detecting abilities due to the angle of incidence.
A few observations are:
- Devices detected more calls when the angle of incidence was 0 degrees
- All devices recorded the fewest calls at 90 degree angle of incidences
- Detectors tended to outperform dataloggers
Any frequency of low intensity and at 90 degrees (angle of incidence) went undetected.

Fig 14. – Comparison of all devices showing frequencies detected at various intensities (top down view) and different angle of incidences (across view). SM2 = SM2Bat+; RL1 = Anabat Roost Logger; BL II = Bat Logger II. (For a PDF version of this figure see pages 13 – 15 of “Lab Test Charts and Tables”.
D. Conclusion
We were able to verify that the vastly different number of calls that our co–located devices detected during the winter field deployment was real. Based on the data from the lab test (performed under controlled conditions), it is clear that devices do not detect ultrasonic signals similarly.
The obvious implication is that different bat detector brands should not be expected to perform similarly and bat dataloggers do not mimic bat detectors. As such, any detector or datalogger–based surveys must make an effort to standardize the brand of the device used. Switching devices and/or using non-standardized equipment (especially in a large–scale sampling effort) will likely result in widely differing results of bat activity.
4. Laboratory test of devices’ ability to capture ultrasonic calls from live bats
Analysis currently ongoing
5. Automatic Identification of Bat Calls – using Kaleidoscope software
To be performed in Fall 2014