
Back | Next | Home
Missoula Technology &
Development Center
|
Table
of Contents | Glossary Back | Next | Home |
Missoula Technology & Development Center |
Estimating Methods, Variability, and Sampling for Drop-Test Data

During the weighing process, the weight and coordinates of each cup are entered into a computer. The weight of the empty plastic cup and lid is subtracted from the total weight and the weight of the liquid in grams is converted to gallons per hundred square feet (gpc) using the density of the liquid. For retardant with a density of 1.095 grams/cubic centimeter, the equation is:
![Equation: gpc=[(x/453.6 grams per pound)/9.13707 pounds per gallon]/0.001944 square feet per cup](images/Equation01.gif)
where x is the amount of retardant in the cup in grams.
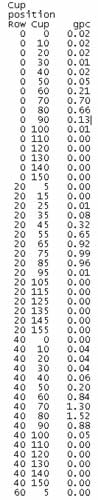
Figure 4 is an example of the computer output after drop samples have been weighed. Cups that were not picked up are assumed to be 0 gpc. This value is included in the array. This array is used to create a map of the drop (figure 5).
 |
 |
| Figure 4—Data array with cup position indicated in columns 1 and 2 and gpc values in column 3. |
Figure 5—A contour plot showing observed gpc values. |
| Back | Next Table of Contents Glossary Cover Page |
Missoula Technology & Development Center |