
Procedures
Figure 2 illustrates a 600- by 155-foot grid. A total of 544 stakes were driven into the ground so their tops were 4 feet high. The stakes were staggered to reduce the distance between known and unknown points.
Examination of hundreds of past drops showed that the rate of change in coverage level was often greater crossrange (perpendicular to the flight path) than downrange (in the direction of the flight path), especially for drops at high speeds. How close should the cups be placed to capture this feature of ground patterns? To answer this question, the spacing was decreased from 10 feet to 5 feet for three crossrange rows (figure 2). The effectiveness of the 5-foot spacing was compared to the 10-foot spacing.
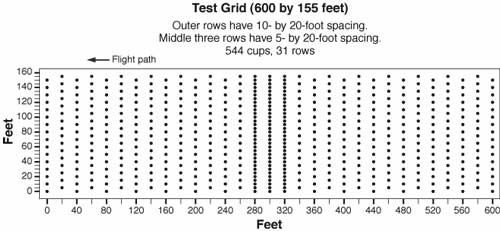
Figure 2—Diagram of the test grid.
After a drop is made, any cup with moisture in it is capped. The row and column numbers are written on the lid, identifying the location of the cup in the grid. All the cups with lids on them are removed and taken to be weighed. Clean cups are put back out on the grid for the next drop (figure 3).

Figure 3—Grid workers gathering cups after a drop.
During the weighing process, the weight and coordinates of each cup are entered into a computer. The weight of the empty plastic cup and lid is subtracted from the total weight and the weight of the liquid in grams is converted to gallons per hundred square feet (gpc) using the density of the liquid. For retardant with a density of 1.095 grams/cubic centimeter, the equation is:
![Equation: gpc=[(x/453.6 grams per pound)/9.13707 pounds per gallon]/0.001944 square feet per cup](images/Equation01.gif)
where x is the amount of retardant in the cup in grams.
Figure 4 is an example of the computer output after drop samples have been weighed. Cups that were not picked up are assumed to be 0 gpc. This value is included in the array. This array is used to create a map of the drop (figure 5).

Figure 4—Data array with cup
position indicated
in columns 1
and 2
and gpc values in column 3.

Figure 5—A contour plot showing observed gpc values.