
Sampling
Spacing in the Downrange Direction
The original grid design shown in figure 2 was compared to a design with wider spacing through cross validation. Every other row was removed in the observed data set to obtain the 40- by 10-foot spacing (figure 18). This subset of 256 values was used to predict, by triangulation, values at the 288 sites that were removed.

Figure 18—The original 20-foot cup spacing was increased to
40
feet in the north-south direction
to evaluate sampling density.
A comparison (table 6) of the predicted gpc values from the 40-foot spacings to the observed values shows a correlation of 0.78, a mean error of –0.01195 gpc and a median error of zero.
|
|
||||||||||||||||||||||||||||||||||||||||||||||||||||||
Spacing in the Crossrange Direction
Spacing in the crossrange direction was also examined (figure 19). The 20- by 5- foot spacing was compared to a 20- by 10-foot spacing.

Figure 19—The original 5-foot spacing was increased to 10
feet
in the crossrange direction to
evaluate sampling density.
Figure 20 shows quantile-quantile (QQ) plots. These plots are used to compare the distribution of estimated to observed values. The distributions are equal when x = y or when the data fall on the 45-degree line. In both plots the distributions are similar. The 40-foot QQ plot shows that the wider spacing is not going to pick up unusually high cup weights. In effect, widening the spacing smooths the results. Going from a 20-foot spacing to a 40-foot spacing is probably too great a jump.
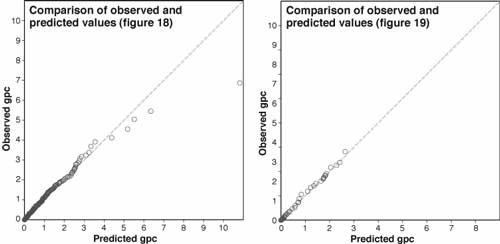
Figure 20—Quantile-quantile (QQ) plots comparing distributions.
However, a 25-foot spacing may be appropriate. More information on the comparison of spacing in the direction of flight can be found in the appendix.
The 10- versus 5-foot comparison shows almost identical distributions. The correlation is high (0.97, table 7) meaning the change in spacing is not producing a big change in the results. Considering the time and costs, the 5-foot spacing would probably not be necessary.
If drop-test data are viewed as spatial data, it is assumed that two cups close together are more likely to have similar values than two that are far apart (Isaaks and Srivastava 1989). To reduce the distance between cups, the stakes can be staggered. Without staggering, the greatest distance between two stakes is 22.36 feet. This distance can be reduced to 20.62 feet with staggering. Even though the difference in distance is less than 10 percent, this small step can help improve accuracy.
|
|
||||||||||||||||||||||||||||||||||||||||||||||||||||||