
Causes of Death
From 1990 to 2006, 310 individuals died during wildland fire operations. Four major causes of death were responsible for 275 (about 89 percent) of the fatalities (figure 4). These causes of death include:
- Aircraft accidents—72 deaths, 23 percent
- Vehicle accidents—71 deaths, 23 percent
- Heart attacks—68 deaths, 22 percent
- Burnovers—64 deaths, 21 percent
 |
 |
 |
Figure 4—The causes of death for 310 persons who
died
during wildland fire operations from 1990 to 2006.
Burnovers
Burnovers were the only cause of death in which fatalities decreased. Burnover fatalities dropped from 39 (4.3 fatalities per year) during the initial period to 25 (3.1 fatalities per year) during the most recent period, a 28-percent decrease in the annual average. The number of fires reported to the National Interagency Fire Center in Boise, ID, (table 1) decreased from an average of 83,296 during the initial period to 79,313 per year during the most recent period. Despite fewer fires during the most recent period, the acres burned each year increased 107 percent from an average of 3.27 to 6.79 million acres.
The fires with the most burnover fatalities during the initial period were the South Canyon Fire (1994, 14 fatalities) and the Dude Fire (1990, 6 fatalities). During the most recent period, the wildland fires with the most fatalities were the Esperanza Fire (2006, five fatalities) and the Thirtymile Fire (2001, four fatalities).
Vehicle Accidents
Vehicle accident fatalities increased more than any other cause of death, from 25 (2.8 fatalities per year) during the initial period to 46 (5.8 fatalities per year) during the most recent period, a 107-percent increase in the annual average. The spike in vehicle accidents (figure 5) can be attributed to: the Forest Service rollover on the Stanza Fire (2002, three fatalities), the Grayback Forestry, Inc. rollover (2002, five fatalities) and the First Strike Environmental Co. accident (2003, eight fatalities). These three accidents killed 16 firefighters. No similar multifatality accidents occurred during the initial period.

Figure 5—Vehicle accidents are now the second most common
cause of
death during wildland fire operations.
Heart attacks caused 29 deaths during the initial period (3.2 fatalities per year), and 39 (4.9 fatalities per year) during the most recent period, a 51-percent increase in the annual average. Volunteer firefighters were the most likely to die from heart attacks (44 deaths, 65 percent of all heart attack fatalities). The number of volunteer firefighters dying from heart attacks probably can be explained by a couple of factors: many more volunteer firefighters are involved in wildland fires on the local level than are agency firefighters, and many volunteer departments have no physical fitness testing or health screening requirements. The National Fire Protection Association said that there were more than 823,350 volunteer firefighters nationwide in 2005.
Since 1998, 11 fire personnel have died while taking or preparing for the Work Capacity Test. In 2000, Federal agencies began implementing a wildland firefighter medical standards program. During 2005 and 2006, there were no reports of firefighters dying while taking or training for the Work Capacity Test.
Aircraft AccidentsAircraft accident fatalities increased from 33 during the initial period (3.7 fatalities per year) to 39 during the most recent period (4.9 fatalities per year), a 33-percent increase in the annual average.
Aircraft accidents involving both fixed-wing (figure 6) and rotary-wing aircraft (figure 7) continue to be a significant cause of death. In recent years, the use of single-engine airtankers (SEATs) for wildland fire operations has dramatically increased. During the most recent period, four fatalities involved SEATs.
Two catastrophic fixed-wing, multiengine airtanker failures resulted in the entire Federal fixed-wing, multiengine airtanker fleet being grounded temporarily. The use of Type 1 and Type 2 helicopters to drop water, foam, and retardant increased dramatically during that period.
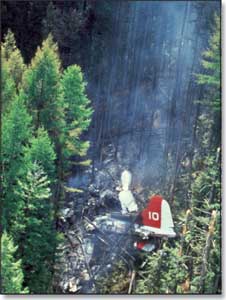
Figure 6—Aircraft accidents were the most common cause of fatalities for
persons who died during wildland fire operations from 1990 to 2006.

Figure 7—Helicopters are being used more frequently
during wildland fire
operations.
Falling trees/snags (figure 8) and rolling rocks claimed the lives of five firefighters during the initial period (0.6 fatalities per year) and seven during the most recent period (0.9 fatalities per year). Given the large number of acres burned during the most recent period and increasing concerns about forest health, it's possible that increased emphasis on snag safety by firefighting agencies and teams may have helped prevent some fatalities. For the entire period, falling trees/snags and rolling rocks caused 12 deaths (4 percent of the total).

Figure 8—Firefighters must stay alert to the dangers
of falling trees/snags
and rolling rocks.
Medical causes other than heart attacks (heat stress, aneurysms, general illnesses) were responsible for three fatalities during the initial period (0.3 fatalities per year) and six during the most recent period (0.8 fatalities per year). These fatalities were distributed evenly between State, county, and volunteer firefighters. The nine deaths accounted for 3 percent of the total fatalities.
Miscellaneous Causes of DeathMiscellaneous causes of death that do not fit into any of the above categories claimed the lives of 3 firefighters during the initial period (0.3 fatalities per year) and 11 firefighters during the most recent period (1.4 fatalities per year). Some of the causes of death in this category include electrocution, lightning, falls, smokejumper training, and murder. The miscellaneous causes classification accounted for 5 percent of all fatalities during the entire period.