
Organizations
The "Safety Gram" breaks firefighters into seven categories based on the fire organization (figure 9): volunteer, Federal, State, contractor, county/rural, private, and military. This report identifies contractors as aviation contractors or ground contractors.
Volunteer FirefightersVolunteers died more often on wildland fires than did firefighters in any of the other groups. The fatalities for volunteers increased from 42 during the initial period (4.7 fatalities per year) to 64 during the most recent period (8 fatalities per year), a 71-percent increase in the annual average. Volunteers accounted for 34 percent of all fatalities during the entire period.
 |
 |
 |
Figure 9—Fatalities grouped by the organizations
of persons
who died during wildland fire operations from 1990 to 2006.
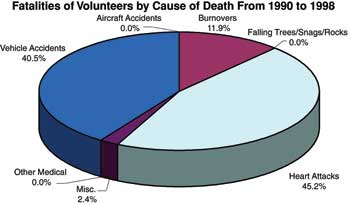
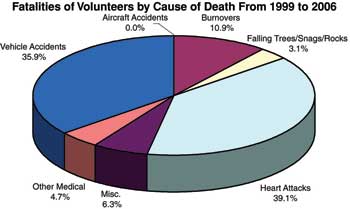
Fatalities for volunteers increased in all categories during the most recent period (figure 10). The largest percentage increase was in heart attack fatalities, which increased from 19 during the initial period (2.1 fatalities per year) to 25 during the most recent period (3.1 fatalities per year), an increase of 48 percent in the annual average.
 |
 |
 |
Figure 10—The causes of death for the volunteers who died
during wildland
fire operations from 1990 to 2006.
Heart attacks were the leading cause of death for volunteers (44 fatalities, 42 percent of all fatalities for volunteers), with vehicle accidents a close second (40 fatalities, 38 percent of all fatalities for volunteers). Burnovers accounted for 11 fatalities (10 percent of all fatalities for volunteers), or less than 1 per year. Other causes of deaths among volunteers include miscellaneous causes (five fatalities), other medical causes (three fatalities), and falling trees/snags and rolling rocks (two fatalities).
Federal FirefightersFederal firefighters suffered 73 fatalities (23 percent of the total) over the entire study period, 36 during the initial period (4 fatalities per year), and 37 during the most recent period (4.6 fatalities per year). Burnovers during 3 fires killed 23 Federal firefighters: South Canyon (14), Esperanza (5), and Thirtymile (4). Two burnover fatalities occurred during prescribed burning operations.
Heart attack fatalities among Federal firefighters (figure 11) increased slightly, from four during the initial period (0.7 fatalities per year) to six during the most recent period (0.8 fatalities per year). Four heart attack fatalities have occurred while firefighters were participating in or training for the Work Capacity Tests since the "Safety Gram" began reporting these fatalities in 1998.
 |
 |
 |
Figure 11— The causes of death for the 73 Federal employees
who died during
wildland fire operations from 1990 to 2006.
Deaths from aircraft accidents increased from six during the initial period (0.7 fatalities per year) to eight during the most recent period (1 fatality per year), a 50-percent increase in the annual average. All but one of the fatalities involved helicopter crashes. Deaths from falling trees/snags and rolling rocks increased from two during the initial period (0.2 fatalities per year) to three during the most recent period (0.4 fatalities per year).
Vehicle accident fatalities remained low for Federal employees (four fatalities in each period). Deaths from miscellaneous causes remained the same (two) during both periods.
State FirefightersState firefighters suffered 42 fatalities (14 percent of the total): 20 during the initial period (2.2 fatalities per year) and 22 during the most recent period (2.8 fatalities per year). Burnover fatalities decreased from 11 during the initial period (including 6 on the Dude Fire, an average of 1.2 fatalities per year) to 4 during the most recent period (0.5 fatalities per year).
Fatalities in aircraft crashes increased from three during the initial period (0.3 fatalities per year) to six during the most recent period (0.8 fatalities per year). Accidents involving State-owned and operated fixed-wing aircraft in California accounted for six of those fatalities. State firefighter fatalities from heart attacks increased from three during the initial period (0.3 fatalities per year) to six during the most recent period (0.8 fatalities per year).
Ground ContractorsGround contractors suffered seven fatalities during the initial period (0.8 fatalities per year): three from vehicle accidents, two from burnovers, one from a heart attack, and one from a falling snag. Ground contractors suffered 19 fatalities during the most recent period (2.4 fatalities per year), when significantly more contractors were in the firefighting workforce. Fourteen of the fatalities were from vehicle accidents, with two accidents accounting for all but one of the fatalities. The remaining fatalities were caused by heart attacks (two) or miscellaneous causes (three). For the entire period, 26 ground contractors died, or 8 percent of the total.
Aviation ContractorsAviation contractors suffered 23 fatalities during the initial period (2.6 fatalities per year) and 25 fatalities during the most recent period (3.1 fatalities per year). The total of 48 deaths constituted 16 percent of all fatalities during the entire period. Four fatalities during the most recent period involved crashes of SEATs, a relatively new tool in air operations.
County FirefightersCounty firefighters suffered a total of 11 fatalities, 6 in the initial period and 5 in the most recent period. Half of the fatalities during the initial period (three) were from burnovers. Causes of death during the most recent period included one fatality from a heart attack, one from other medical causes, one from a vehicle accident, and one from miscellaneous causes. County firefighter fatalities accounted for 4 percent of all fatalities.
Private IndividualsTwo private individuals acting on their own behalf were killed by a burnover during the initial period. During the most recent period, one private individual was killed in a vehicle mishap while rushing to a fire. These three fatalities comprised 1 percent of the total fatalities. On February 2, 2005, the "Safety Gram" criteria were updated. The "Safety Gram" no longer includes fatalities of private individuals acting on their own behalf.
Military PersonnelOne member of the military was killed in an aircraft fatality during 1994. That military fatality represents less than 1 percent of the total fatalities. The military generally is asked to help only during severe fire seasons after all other resources have been committed.