

Evaluation of Two Fully Rugged Laptop Computers for the Forest Service
Test Results
Environmental and feature comparison tests for fully rugged mobile computing on the CF-30 and XR-1 laptops were conducted at MTDC. Environmental tests were performed with guidance from MIL-STD-810F.
They included:
- Startup and operation during extremely cold and hot
temperatures—These tests assessed the laptops' ability
to start up and operate at extreme conditions (-15 °F
and 120 °F). Both laptops passed each test.
Moisture/rain—This test assessed the laptops' ability
to withstand a 4-in/h, 40-mi/h rain for 10 min on all
sides (figure 2). Both laptops passed each test.
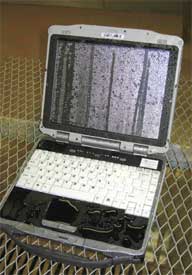
Figure 2—The laptops were tested for rain/moisture resistance. The laptops
were sprayed for 10 minutes on each axis with a simulated rain of 4 in/h at
40 mi/h. Both laptops passed all rain/moisture tests.
- Drop/shock—This test assessed the laptops' ability to
withstand drops and sudden shocks. The laptops were
dropped six times (one drop on each axis) from 36
in onto 2-in-thick plywood placed on concrete. After
each drop, the laptops were investigated for damage
and tested for functionality. The CF-30 laptop passed
all drop tests. The XR-1 laptop developed a crack
(figure 3) in the plastic around the screen after one of the drops. It still functioned normally, but its integrity was compromised.

Figure 3—The laptops were drop tested to test shock resistance. The laptops
were dropped onto plywood from 3 feet on all six axes. The XR-1 laptop
developed a crack in the case around the screen after one of the drops.
- Vibration—This test assessed the laptops' ability to withstand vibration. Each laptop was placed on a vibration table for 1 h and then turned on to verify that all components operated. Both laptops passed the vibration test.
Comparison tests of different features included:
- Screen brightness and visibility—Screen brightness and visibility were compared in several different situations and configurations. Photographs were taken of the laptop screens in full sun and in a dark room. The laptop screens were compared with black lettering on a white background and also with a color palette as a background. Results showed that the CF-30 screen set at 1,000 nits was brighter and easier to read than the original XR-1 screen, especially when the laptops were tested in full sun (when it is most difficult to read text and see graphics on a screen, figure 4). Although the new XR-1 DynaVue screen is not as bright as the CF-30 screen, the DynaVue screen has less glare and better color contrast in full sun, making it easier to read text and see graphics. The XR-1 has a lower screen brightness in a dark setting (figure 5). Dimmer screens are important for law enforcement officers, who do not want to draw attention to themselves when they are working at night.

Figure 4—The laptops were compared side-by-side to determine
how well the
screen could be seen in direct sunlight. While
the screen of the CF-30
laptop was brighter, the new DynaVue
screen of the XR-1 laptop had better contrast
and less glare,
making it easier to view.
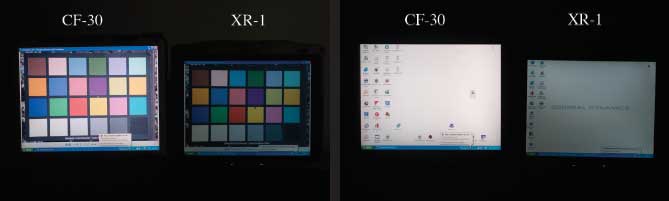
Figure 5—The laptops' screens were also compared in a dark setting.
It is important to law enforcement officers that the screen is
not too bright
in the
dark so their position is not compromised.
The XR-1 screen (the right screen
in each pair of photos) was
much darker (but readable) at its lowest setting.
- Battery life—Battery life is critical when users
are collecting field data. MobileMark 2007 battery
performance software was used to measure the battery
life of each laptop in different modes. The CF-30
laptop had a much longer battery life, especially when
compared to the new XR-1 laptop with the DynaVue
screen (figure 6). The battery in the CF-30 laptop lasts
about 6 h (368 min) when set at 500 nits, about 129
percent longer than the battery in the XR-1 laptop with
the DynaVue screen (161 min). Even when the display in the CF-30 laptop
is set to 1,000 nits, the battery
lasts 84 percent longer (297 min) than the battery in
the XR-1 laptop with the DynaVue screen.
- Performance benchmarking—Three different industry standard performance benchmarking software suites (FutureMark's PCMark and 3DMark tests and the PassMark Performance Test 6.1) were used to test the laptops' processor and components. On average in all three software suites, the XR-1 laptop tested 29 percent higher than the CF-30 laptop (figure 7).

Figure 6—MobileMark 2007 battery performance software was used
to measure
battery life. The CF-30 battery lasted nearly
twice as long as the XR-1 battery.
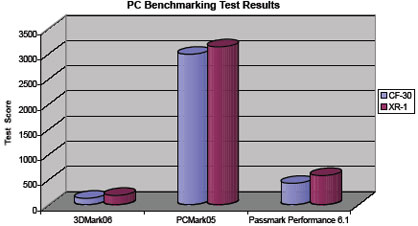
Figure 7—Three different performance benchmarking software
suites were
used to test the laptops' processor and components.
The XR-1 performed better in all benchmarking tests.
- GPS accuracy—The accuracy of the laptops' internal
GPS (global positioning system) receivers was tested
by comparing the locations reported by the GPS
receiver to known surveyed locations. These tests
were conducted at the MTDC GPS test course in
the University of Montana's Lubrecht Experimental
Forest near Missoula, MT, and at MTDC. Tests
were conducted in an open canopy and in a forested
canopy, and from inside or outside of a vehicle. The
GPS receiver in the XR-1 laptop was more accurate,
especially at the forested canopy location. On average,
it was twice as accurate (figure 8).
- WLAN throughput testing—Both laptops have built in
WLAN (IEEE 802.11, commonly known as Wi-Fi)
wireless networking. The throughput of each laptop
was tested at three different signal strengths using
Ixia's IxChariot software. Throughput tests showed little difference
between the two laptops. The signal
strength of each laptop also was compared to the
other. Each laptop was placed on the dash of a vehicle
and the vehicle was driven around a parking lot near a
WLAN access point. The PassMark WirelessMon 2.0
software logged the signal strength of each laptop with
a time stamp. Results showed no difference between
the two laptops.
- WWAN throughput testing—Each laptop's Verizon Wireless Aircard was tested using a protocol similar to that used during the WLAN testing. Throughput testing was conducted at three different signal strengths. The XR-1 laptop had much better throughput results, probably because it had a newer generation Verizon Wireless Aircard than the CF-30 laptop.

Figure 8—Results from the forested canopy GPS accuracy tests
at the Lubrecht
Experimental Forest GPS test course. Accuracy
results
are based on National Standard for Spatial Data
Accuracy formulas. Lower values
mean better accuracy.