

Life-Cycle Cost Analysis for Buildings Is Easier Than You Thought
Life-Cycle Assessments Can Help You Make Sustainable Choices
While a life-cycle cost analysis is a financial tool, a life-cycle assessment evaluates the environmental costs associated with a product, process, structure, or activity by identifying energy and materials used and wastes released to the environment. In this context, the term "life cycle" means the assessment considers everything that goes into or is produced as a result of the product or service. This starts with production of raw materials and includes manufacture, distribution, use, disposal, transportation, and the energy used by the product, process, structure, or activity. This is sometimes referred to as a "cradle-to-grave" (figure 6) assessment. The sum of the cradle-to-grave environmental costs is the life-cycle environmental cost of the product.
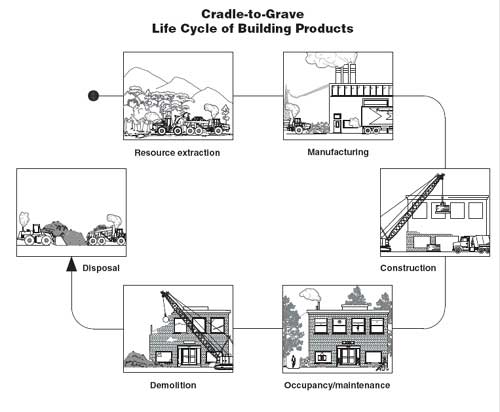
Figure 6—In a cradle-to-grave life cycle, building
materials are used once and then discarded.
Some products can be partly or completely reused or remanufactured into new products after they have served their original purpose. In these cases, the cycle is often referred to as "cradle-to-cradle" (figure 7). An example of a cradle-to-cradle product is an aluminum beverage can. Aluminum production is extremely energy intensive, but aluminum is fully recyclable no matter how many times it has already been recycled. Manufacturing new cans from recycled cans cuts energy use by 95 percent, making aluminum cans a cradle-to-cradle product. Unfortunately, only about half of the aluminum cans produced in the United States are recycled, so there's still some "grave" in aluminum can production.

Figure 7—Building materials that are no longer needed for their
original purpose
are recycled or reused in a cradle-to-cradle life cycle.
To illustrate the life-cycle assessment process, consider a comparison of the environmental costs of beverage packaging made of glass, aluminum, and plastic. Cradle-to cradle assessments for all three options must be performed. For glass bottles, this would include mining of silica and other minerals, proportional costs of recycled content, bottle production, bottling, transport, and disposal or recycling. For aluminum, the assessment would include mining bauxite, production of aluminum (including proportional costs of recycled content), production of cans, filling the cans, transport, and disposal or recycling. For plastic bottles, the assessment would include raw oil production, oil refining, proportional costs of recycled content, polymer production, bottle production, bottling, transport, and disposal or recycling. The analysis must include proportional life-cycle costs of products that go into the manufacture or use of each product, such as catalysts needed during the production of the plastic polymer. Raw materials mined or grown, land uses, noise generation, releases of pollutants to the air, water, or soil, and all other ecological costs are evaluated and compared.
Identifying all these environmental costs is difficult and time consuming. To ease the process, several analysis programs have been developed. An alphabetical list, brief summaries, and Web addresses of some of these software tools are available in the "Life-Cycle Assessment Software" section at the end of this report. Each program provides different advantages, levels of detail, weights for different sorts of environmentally detrimental factors, and ability to provide meaningful output for nonstandard materials and assemblies.
Although life-cycle assessment is not required for Forest Service structures, it can provide valuable information that can help decisionmakers choose more environmentally friendly materials and systems.
Summary
Life-cycle cost analysis is not as difficult as it might appear to be. By using the simplified formula explained in this report for small decisions and the eVALUator or BLCC and supplemental software for large decisions, Forest Service decisionmakers will have the financial information they need to make responsible maintenance, improvement, and construction choices. Because decisions based on life-cycle cost effectiveness almost always lead to decisions to purchase more durable and energy-efficient products and systems (figure 8), LCCA is good for the environment. In addition, life-cycle assessment software can be used to compare the environmental effects of different systems and products, leading to better informed choices about environmentally friendly materials and systems.
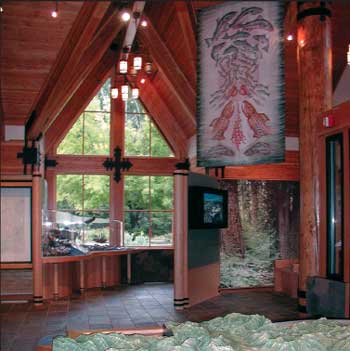
Figure 8—The durable wood walls and slate
floors of the visitor information center and
entry to the McKenzie River Ranger Station
although initially expensive, will stand up to
the demands of high visitor use far longer than
less durable materials (Willamette National
Forest, Pacific Northwest Region).
Life-Cycle Cost Analysis Software
Free Software
Building for Environmental and Economic Sustainability (BEES) (http://www.bfrl.nist.gov/oae/software/bees/) is a tool that helps select cost-effective building products from more than 200 environmentally preferred items. BEES is based on consensus standards and measures the environmental performance of building products by using the life-cycle assessment approach specified in the International Organization for Standardization (ISO) 14040 series of standards (http://www.iso.org/iso/home.htm). BEES has been adapted for application to biobased products—see BEES for USDA (http://www.bfrl.nist.gov/oae/software/bees/bees_USDA.html). BEES has been supported in part by the U.S. Environmental Protection Agency’s Environmentally Preferable Purchasing program (http://www.epa.gov/epp/).
The Chilled Water System Analysis Tool (http://www1.eere.energy.gov/industry/bestpractices/software.html) is used to determine the energy requirements of chilled water cooling systems and to evaluate opportunities for energy and cost savings by applying improvement measures. The program, developed by the U.S. Department of Energy (DOE), allows you to calculate the current energy consumption of an existing system, then select proposed equipment or operational changes for comparison.
The Combined Heat and Power Application Tool (http://www1.eere.energy.gov/industry/bestpractices/software.html) is used to evaluate the feasibility of combined heat and power. This tool, developed by the DOE, will estimate system costs and payback period. It also performs "what if" analyses for various utility costs. It includes performance data and preliminary cost information for many commercially available gas turbines and default values that can be adapted to meet specific application requirements.
The Construction Waste Calculator (http://www.metrokc.gov/dnrp/swd/greenbuilding/construction-recycling/cost-effectiveness.asp) from King County Solid Waste Division, WA, explains how to determine the cost effectiveness of recycling versus disposal by using the Recycling Economics Worksheet (http://www.metrokc.gov/dnrp/swd/greenbuilding/ documents/economics_worksheet.xls). The worksheet contains separate calculation sheets for commercial-hauling and self-hauling options, as well as samples of completed worksheets.
The Cool Roof Calculator estimates cooling and heating savings for flat and low-slope roofs with surfaces that are not black. It includes DOE Web-based software programs for managers of small and medium-sized facilities that purchase electricity without a demand charge (http://www.ornl.gov/sci/roofs+walls/facts/CoolCalcEnergy.htm) and for large facilities that purchase electricity with a demand charge based on peak monthly load (http://www.ornl.gov/sci/roofs+walls/facts/CoolCalcPeak.htm).
DOE-2 (http://www.doe2.com/) is a frequently updated FORTRAN program developed by James J. Hirsch & Associates in collaboration with Lawrence Berkeley National Laboratory. It calculates the hourly energy use and energy cost of a commercial or residential building based on user-supplied information about the building's climate, construction, operation, utility rate schedule, and heating, ventilating, and air-conditioning (HVAC) equipment. It can be used in its basic form or accessed through a friendlier interface such as eQUEST, EnergyPlus, Green Building Studio, or PowerDOE, all of which are described in this section.
Energy Cost Calculators (http://www.fedcenter.gov/_kd/go.cfm?destination=ShowItem&Item_ID=8336) from the Federal Energy Management Program allow users to enter their own utility rates, hours of use, and so forth, to estimate the energy cost savings from buying a more efficient product. Calculators are available for compact fluorescent lamps, commercial unitary air conditioners, air-cooled chillers, water-cooled chillers, commercial heat pumps, boilers, refrigerators, freezers, beverage vending machines, computers, monitors, faxes, printers, copiers, faucets/showerheads, toilets/urinals, central air conditioners, gas furnaces, electric/gas water heaters, clothes washers, and dishwashers.
Energy-10 (http://www.nrel.gov/buildings/energy10.html) from the National Renewable Energy Laboratory helps architects and building designers quickly identify the most cost-effective energy-saving measures for small commercial and residential buildings. It integrates daylighting, passive solar heating, and low-energy cooling strategies with energy efficient shell design and mechanical equipment. It enables designers to make good decisions about energy efficiency early in the design process.
EnergyPlus (http://www.eere.energy.gov/buildings/energyplus/) is a DOE building energy simulation program for modeling a building’s heating, cooling, lighting, ventilating, and other energy flows. It is based on the most popular features and capabilities of DOE-2, but it includes simulation capabilities such as time steps of less than an hour, modular systems, HVAC zone simulation, multizone air flow, thermal comfort, and photovoltaic systems.
eQUEST (http://www.energydesignresources.com/resource/130) was developed by Energy Design Resources to perform a detailed analysis of state-of-the-art building design technologies without requiring extensive experience in the "art" of building performance modeling. It combines a building creation wizard, an energy efficiency measure wizard, and a graphical results display module with a DOE-2 building energy-use simulation program. Results are displayed in tables and graphs. eQUEST appears to be one of the most popular energy-use simulation programs, probably because of its ability to display energy consumption over time using colorful, easy to- read graphs and tables.
The Financing Alternatives Comparison Tool (http://epa.gov/owm/cwfinance/cwsrf/fact.htm) is a U.S. Environmental Protection Agency (EPA) financial analysis tool that helps identify the most cost-effective method to fund a wastewater or drinking water management project. This tool produces a comprehensive analysis that compares various financing options for these projects by incorporating financing, regulatory, and other important costs.
The Life-Cycle Cost Analysis Model (http://www.green.ca.gov/LCCA/default.htm) was developed by the State of California to determine the cost effectiveness of implementing energy conservation measures using the results of energy audits or energy feasibility studies. This Excel spreadsheet has information specific to California (details about energy costs, California energy tariffs, peak/part-peak/off-peak rates, etc.) already filled in, although the information can be modified. The model provides detailed analysis of energy cost savings and implementation costs.
Radiance (Windows version at http://radsite.lbl.gov/deskrad/ and Unix version at http://radsite.lbl.gov/radiance/) is a tool for lighting design and rendering, developed by the DOE and the Swiss Federal Government through the Lawrence Berkeley National Laboratory. It quantitatively renders daylight in building models to provide graphic displays and luminance numbers that can be used to determine how much artificial lighting is needed in a room or how room configuration could be changed to eliminate the need for artificial light.
The Target Finder (http://www.energystar.gov/index.cfm?c=new_bldg_design.bus_target_finder) is an EPA energy modeling tool that helps architects and building owners set aggressive, realistic energy targets and rate a commercial building's estimated energy use, based on the EPA's survey of existing buildings and climate by ZIP code. Site and source energy calculations are provided for both energy use intensity and total annual energy.
The Unitary Air Conditioner Cost Estimator (http://www1.eere.energy.gov/femp/procurement/eep_unitary_ac_calc.html) compares high-efficiency rooftop air conditioners to standard equipment in terms of life-cycle cost. This estimator, developed by the DOE, accounts for local climate and partial load as well as full load efficiencies. The Web-based, menu-driven format is easy to learn and use. It quickly estimates life-cycle cost, simple payback, return on investment, and the savings-to-investment ratio based on user-specified air conditioning requirements and building use patterns. Results are easily downloaded as graphic files for further analysis or for presentations.
Commercial Software
Ecotect (http://squ1.com/) is a whole-building simulator from Square One Research that "combines an interactive building design interface and 3D modeler with a wide range of environmental analysis tools for a detailed assessment of solar, thermal, lighting, shadows and shading design, energy and building regulations, acoustics, air flow, cost, and resource performance of buildings at any scale." It works with Square One's CAD engine, or you can import building information from AutoCAD.
Green Building Studio (http://usa.autodesk.com/adsk/servlet/index?siteID=123112&id=11179531) is one of the many interfaces to DOE-2. It also is compatible with other energy-analysis software. Green Building Studio has tools that help evaluate building designs for energy consumption and carbon footprints.
PowerDOE (http://www.doe2.com/Download/Docs/D22PDSum.pdf) is a commercial interface to DOE-2 (see the "Free Software" section) that uses graphics, building images, and models to both organize data input and display building energy use for heating, cooling, lighting, ventilating, and so forth.
The Virtual Environment (http://www.iesve.com/content/default.asp?page=home_Our%20Software) can act as a plugin to AutoCAD's Revit, calculating heating and cooling loads. Developed by Integrated Environmental Solutions, Ltd. This plugin can also be used to model several other systems from within Revit.
Life-Cycle Assessment Software
Free Software
Building for Environmental and Economic Sustainability (BEES) (http://www.bfrl.nist.gov/oae/software/bees/) is a tool that helps select cost-effective building products from more than 200 environmentally preferred items. BEES is based on consensus standards and measures the environmental performance of building products by using the life-cycle assessment approach specified in the International Organization for Standardization (ISO) 14040 series of standards (http://www.iso.org/iso/home.htm). BEES has been adapted for application to biobased products—see BEES for USDA (http://www.bfrl.nist.gov/oae/software/bees/bees_USDA.html). BEES has been supported in part by the U.S. Environmental Protection Agency’s Environmentally Preferable Purchasing program (http://www.epa.gov/epp/).
Building Materials Reuse Calculator (http://www.wastematch.org/calculator/calculator.htm) from New York City’s NY Wa$teMatch Materials Exchange estimates the environmental benefits of salvaging and reusing building materials, rather than buying and installing new ones. The calculator measures the environmental benefits of reusing building materials.
Pharos (http://www.pharoslens.net/about/) is a labeling system that is sponsored by the Healthy Building Network and its partners. The labeling system, still being developed, is intended to be a consumer-friendly display of the evaluation of materials across impact categories, including energy/ water usage, air quality impacts, toxicity, occupational safety, social justice, and habitat impacts. The PharosWiki (http://www.pharosproject.net/wiki/index.php?title=Main_Page) is available, although the labeling system was not yet available when this report was prepared.
Commercial Software
Impact Estimator for Buildings (http://www.athenasmi.ca/tools/impactEstimator/) allows comparisons of the environmental implications of conceptual designs. It covers more than 90 structural and envelope materials, simulates more than 1,000 different assembly combinations, and claims to be capable of modeling 95 percent of the building stock in North America. The software was developed by the nonprofit Athena Institute, a Canadian research and development organization that focuses on sustainability and life-cycle assessments of buildings.
Example Life-Cycle Cost Analysis Reports
| eVALUator Comparative Analysis - Owner/Occupant Scenario | |||
| Analysis prepared for: | Occupant Missoula, MT |
||
| Base Case: | Standard | ||
| Alternative: | Actual | ||
| Initial Pro-Forma | |||
| Loan term | 15 yr. | ||
| Loan interest rate | 4.8% | ||
| Salary costs | $ / yr. | ||
| Productivity improvement | .0% | ||
| Baseline | Alternative | Change | |
| Project Cost | $200,000 | $210,000 | $10,000 |
| % Financed | 45.0% | 45.0% | |
| Up-front Equity | $110,000 | $115,498 | $5,498 |
| Annual Debt Service | $8,554 | $8,982 | $428 |
| Non-Energy Expenses | $2,503 | $1,499 | -$1,004 |
| Energy Expenses | $2,036 | $1,039 | |
| Productivity Impacts | $0 | $0 | $0 |
| Cash flow improvement | $1,573 | -$997 | |
| Simple payback | 10 yr. | ||
| Life Cycle Analysis (Net Present Value) | |||
| Discount Rate | 5% | ||
| Analysis Period | 25 | ||
| Baseline | Alternative | Change | |
| Non-Energy Expenses | $49,203 | $29,467 | -$19,736 |
| Energy Expenses | $40,772 | $20,802 | -$19,969 |
| Productivity Impacts | $0 | $0 | $0 |
| Up-front Equity | $110,000 | $115,498 | $5,498 |
| Debt Service | $88,787 | $93,225 | $4,438 |
| Replacement Costs | $8,431 | $8,431 | $0 |
| Total Life Cycle Costs | $297,193 | $267,423 | -$29,770 |
| Savings-to-Investment Ratio | 4 | ||
| Adj. internal rate of Return | 11.0% | ||
NIST BLCC 5.3-07: Comparative Analysis Consistent with Federal life-cycle cost methodology and procedures, 10 CFR, part 436, subpart A |
||
| Base Case: standard | Alternative: actual | |
| General Information | ||
| File Name: | C:\Program Files\BLCC5\projects\occupant.xml | |
| Date of Study: | Wed Nov 14 14:57:54 MST 2007 | |
| Project Name: | Occupant | |
| Project Location: | Montana | |
| Analysis Type: | FEMP Analysis, Energy Project | |
| Analyst: | Occupant | |
| Base Date: | November 1, 2007 | |
| Service Date: | November 1, 2008 | |
| Study Period: | 25 years 0 months (November 1, 2007, through October 31, 2032) | |
| Discount Rate: | 5% | |
| Discounting Convention: | End-of-Year | |
| Comparison of Present-Value Costs | ||||
| PV Life-Cycle Cost | ||||
| Base Case | Alternative | Savings from Alternative | ||
| Initial Investment Costs: | ||||
| Capital Requirements as of Base Date | $200,000 | $210,000 | -$10,000 | |
| Future Costs: | ||||
| Energy Consumption Costs | $31,183 | |||
| Energy Demand Charges | $0 | $0 | $0 | |
| Energy Utility Rebates | $0 | $0 | $0 | |
| Water Costs | $15,049 | $8,332 | $6,717 | |
| Recurring and Non-Recurring OM&R Costs | $41,108 | $24,665 | $16,443 | |
| Capital Replacements | $6,839 | $6,839 | $0 | |
| Residual Value at End of Study Period | -$3,207 | -$3,207 | $0 | |
| Subtotal (for Future Cost Items) | $90,972 | $52,254 | $38,718 | |
| Total PV Life-Cycle Cost | $290,972 | $262,254 | $28,718 | |
| Net Savings from Alternative Compared with Base Case | ||||
| PV of Non-Investment Savings | $38,718 | |||
| - Increased Total Investment | $10,000 | |||
| Net Savings | $28,718 | |||
| Savings-to-Investment Ratio (SIR) | SIR = 3.87 | |||
| Adjusted Internal Rate of Return | AIRR = 10.80% | |||
| Payback Period - | Estimated Years to Payback (from beginning of Service Period) | |||
| Simple Payback occurs in year | 8 | |||
| Discounted Payback occurs in year | 10 | |||
| Energy Savings Summary | ||||
| Energy Savings Summary (in stated units) | ||||
| Energy | ----Average Annual Consumption---- | Life-Cycle | ||
| Type | Base Case | Alternative | Savings | Savings |
| Electricity | 37.5 MBtu | 18.9 MBtu | 18.6 MBtu | 446.7 MBtu |
| Natural Gas | 70.0 MBtu | 34.8 MBtu | 35.2 MBtu | 844.7 MBtu |
| Emissions Reduction Summary | ||||
| Energy | ----Average Annual Consumption---- | Life-Cycle | ||
| Type | Base Case | Alternative | Savings | Savings |
| Electricity | ||||
| CO2 | 11,495.31 kg | 5,793.63 kg | 5,701.67 kg | 136,823.86 kg |
| SO2 | 4.45 kg | 2.24 kg | 2.21 kg | 52.99 kg |
| NOx | 22.38 kg | 11.28 kg | 11.10 kg | 266.34 kg |
Natural Gas |
||||
| CO2 | 3,697.58 kg | 1,838.23 kg | 1,859.35 kg | 44,619.22 kg |
| SO2 | 29.84 kg | 14.84 kg | 15.01 kg | 360.09 kg |
| NOx | 2.88 kg | 1.43 kg | 1.45 kg | 34.76 kg |
| Total: | ||||
| CO2 | 15,192.89 kg | 7,631.86 kg | 7,561.03 kg | 181,443.07 kg |
| SO2 | 34.29 kg | 17.08 kg | 17.21 kg | 413.08 kg |
| NOx | 25.26 kg | 12.71 kg | 12.55 kg | 301.10 kg |
About the Author
Kathleen Snodgrass came to MTDC as a project leader in 2001. She graduated from Washington State University in 1974 with a bachelor of science degree in architectural studies, then spent about 10 years in highway design and construction with the Idaho Division of Highways. She began her career with the Forest Service in 1984. Snodgrass worked in facilities, landscape architecture, land line, and general engineering on the Nez Perce National Forest for 10 years and was the forest’s facilities architect for about 7 years before coming to MTDC.
Additional single copies of this document may be ordered from:
USDA Forest Service
Missoula Technology and Development Center
5785 Hwy. 10 West
Missoula, MT 59808–9361
Phone: 406–329–3978
Fax: 406–329–3719
E-mail: wo_mtdc_pubs@fs.fed.us
Electronic copies of MTDC's documents are available on the Internet at:
http://www.fs.fed.us/eng/t-d.php
For additional information about life-cycle cost analysis, contact Kathie Snodgrass at MTDC:
Phone: 406–329–3922
Fax: 406–329–3719
E-mail: ksnodgrass@fs.fed.us
Forest Service and Bureau of Land Management employees can search a more complete collection of MTDC's documents, CDs, DVDs, and videos on their internal computer networks at: