

Smoke Particulate Monitors: 2006 Update
Long Description for Figure 11
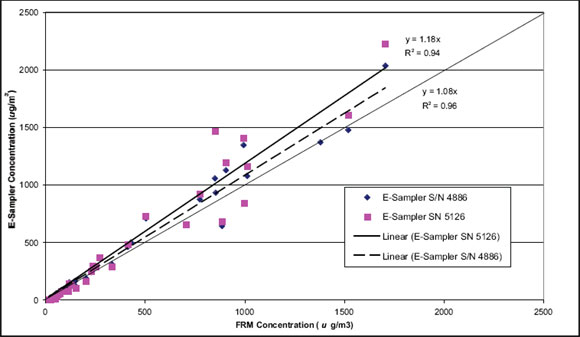
Figure 11—Results for the two E-Samplers compared to the
BGI PQ-200 Federal
Reference Method
sampler.
This chart compares the test results of the Federal Reference Monitor to two E-Samplers. The Federal Reference Monitor test concentrations are on the x-axis. The E-Sampler concentrations are on the y-axis. The chart shows the linear regression best fit lines for both E-Samplers. The slope for one E-Sampler is 1.18. The other is 1.08.