

Smoke Particulate Monitors: 2006 Update
Results and Discussion
A total of 38 tests were conducted. The average particulate concentrations ranged from 21 to 1,706 micrograms per cubic meter as measured by the FRM sampler. Statistical results were based on least squares-linear regression equations and correlation coefficients (R2). Table 1 shows the results for all the instruments. Figures 9, 11, 12, 14, and 15 show the results for each instrument when compared to the FRM sampler. Each figure shows the appropriate data points, the slope equation, and the correlation coefficient for the best-fit line. A line representing a 1:1 relationship also is shown. Figure 10 shows the comparison between the ac pump and dc pump versions of the EBAM. Figure 13 shows the comparison between a DUSTTRAK with the PM2.5 cutoff inlet installed and two DUSTTRAKs with PM10 cutoff inlets installed.
| Real-time particulate Monitor | Regression Slope | Correlation Coefficient |
|---|---|---|
| E-BAM (S/N C5193—ac pump) | 1.01 | 0.96 |
| E-BAM (S/N E4052—dc pump) | 1.01 | 0.97 |
| E-Sampler (S/N 4886) | 1.08 | 0.96 |
| E-Sampler (S/N 5126) | 1.18 | 0.94 |
| DUSTTRAK (S/N 22347) | 3.25 | 0.96 |
| DUSTTRAK (S/N 22349) | 3.18 | 0.96 |
| DUSTTRAK (S/N 85200005) | 3.09 | 0.96 |
| DataRAM 2000 (S/N 2574) | 1.25 | 0.97 |
| DataRAM 2000 (S/N 2575) | 1.30 | 0.97 |
| DataRAM 2000 (S/N 2576) | 0.89 | 0.97 |
| DataRAM 4 (S/N D041) | 2.61 | 0.95 |
| DataRAM 4 (S/N D042) | 2.19 | 0.96 |
| DataRAM 4 (S/N D043) | 2.58 | 0.95 |
| DataRAM 4 (S/N D044) | 2.37 | 0.96 |
E-BAM—Comparisons between the E-BAM monitors and the FRM sampler are shown in figure 9. Results were essentially identical. Both of the E-BAMs overestimated the smoke particulate concentrations by 1 percent. Correlation coefficients were 0.96 and 0.97. Figure 10 shows the comparison between the ac pump version of the EBAM and the dc pump version. Results of the two E-BAMs were almost identical.

Click image for large view
Figure 9—Results for the two E-BAM monitors compared
to the BGI PQ-200
Federal Reference Method sampler.

Click image for large view
Figure 10—Results comparing an external ac electrical pump to
an internal
dc pump on an E-BAM
monitor.
E-Sampler—Figure 11 shows the comparison of the E-Samplers and the FRM sampler. On average, the E-Samplers overestimated the concentration by 13 percent. E-Sampler serial number 4886 overestimated the concentration by 8 percent while E-Sampler serial number 5126 overestimated the concentration by 18 percent. Correlation coefficients for both results were higher than 0.94.

Click image for large view
Figure 11—Results for the two E-Samplers compared to the
BGI PQ-200
Federal
Reference Method
sampler.
DUSTTRAK—Results for the three DUSTTRAK monitors evaluated and the FRM sampler are shown in figure 12. On average, the DUSTTRAK overestimated the smoke particulate concentration by 217 percent (3.17 times). The difference of the results among the instruments was +/-2.5 percent.

Click image for large view
Figure 12—Results for the three DUSTTRAK monitors compared to the
BGI
PQ-200 Federal Reference
Method sampler.
Figure 13 shows the comparison between the DUSTTRAK equipped with the PM2.5 cutoff inlet installed and the DUSTTRAKs with the PM10 cutoff inlet installed. Results (5-minute averages) were essentially identical. Most smoke particles are smaller than 2.5 microns, so neither cutoff inlet would be expected to have much effect.

Click image for large view
Figure 13—Results showing DUSTTRAK monitors
configured with a PM2.5 or
a PM10 cutoff inlet.
DataRAM 2000—Three Data-RAM 2000s were operated during the tests. Figure 14 shows the results from the DataRAM 2000 monitor compared to the FRM sampler. On average, the DataRAM 2000s overestimated particulate concentrations by 15 percent. DataRAM serial number 2575 overestimated the particulate concentrations by 30 percent while DataRAM serial number 2576 underestimated the concentrations by 11 percent. Correlation coefficients were 0.97.
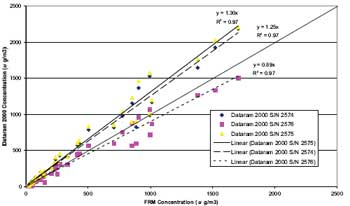
Click image for large view
Figure 14—Results for the three DataRAM 2000 monitors
compared
to the
BGI PQ-200 Federal
Reference Method sampler.
DataRAM 4—Four DataRAM 4s were evaluated. Figure 15 shows the results of DataRAM 4 monitor compared to the results from the FRM sampler. On average, the DataRAM 4s overestimated the smoke particulate concentration by 144 percent. Data-RAM 4 serial number D041 overestimated concentrations the most (161 percent), while DataRAM 4 serial number D042 overestimated concentrations the least (119 percent). Correlation coefficients were all high, at least 0.95.

Click image for large view
Figure 15—Results for the four DataRAM 4 monitors compared to
the BGI
PQ-200 Federal Reference
Method sampler.