skip to main page content USDA Forest Service logoPrivacy | Legal
Forest Service Technology & Development logo
Technology &
Development Center
Table of Contents

Back

Smoke Particulate Monitors: 2006 Update

Long Description for Figure 15

Graphic of a graph.
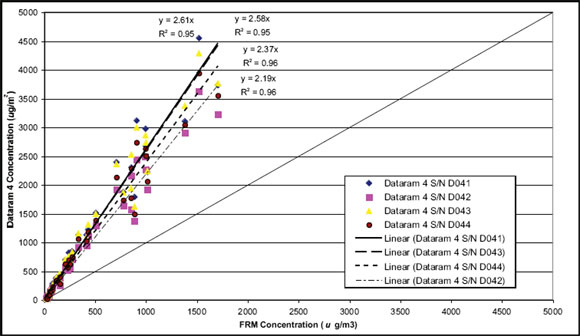
Figure 15—Results for the four DataRAM 4 monitors compared to
the BGI PQ-200 Federal Reference Method sampler.

This chart compares the test results of the Federal Reference Monitor to four DataRam 4's. The Federal Reference Monitor test concentrations are on the x-axis. The DataRam 4 concentrations are on the y-axis. The chart shows the linear regression best fit lines for the four DataRams. The slopes of the lines are 2.61, 2.58, 2.37, and 2.19.

back to main page content

Top

Back

Shield logo for USDA Forest Service
mailbox icon E-mail: wo_mtdc_webmaster@fs.fed.us

Forest Service Technology & Development logo

Technology &
Development Center

UsableNet Approved (v. 1.4.1)


Visitor hit counter hit counter hit counter hit counter hit counter hit counter since January 12, 2006