

Fathoming the snow depths
CALIFORNIA—In California, the new year arrived on the wave of an atmospheric river, carrying enough water to near the daily flow that discharges from the Mississippi River. Much of this aerial stream has fallen as rain, but some has touched down as snow.
This is glad tidings for snow seekers. On national forests, snow lays the foundation for an abundance of winter activities, including snowmobiling, skiing, snowboarding, peak bagging and snowshoeing. But before enjoying these activities, visitors need to know where to go for snow.

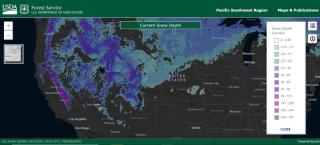
“I came up with the snow-depth map because I know people interested in recreation always want to know how much snow there is and know what elevation the snow starts,” said Brian Moran, cartographer, Pacific Southwest Region, USDA Forest Service.
The art of cartography and an enduring fascination with weather merge in the snow-depth map. Inches of snow are represented in neon hues of purple, blue and pink. Viewers can interact with these fluorescent features by zooming into the landscape and switching to the topographic base map.
Moran has been making maps and atlases—folded-paper, spiral-bound and digital—for the Pacific Southwest Region since 2007. He came into cartography through his first love: the weather.
“I was a big weather geek as a kid. I kind of still am,” Moran shared. “I went to school thinking I was going to be a meteorologist, but then discovered that I was more into the spatial and visual aspects of weather data and maps. So I switched over to geography and then discovered GIS and cartography.”

Cartography is a science, too. Since he started making the map in 2018, Moran uses public data from the National Oceanic and Atmospheric Administration. By merging satellite, airborne and ground observations into a mathematical model, NOAA updates snow-depth mapping imagery daily.
“There's a whole bunch of different factors you want to know about when you're heading up there to the winter sports,” Moran pointed out. “I just didn't see another site that was using this public snow depth data and displaying it in a consumer-friendly way.”