

National Agricultural Imagery Program Status Maps Help
NPDI Status Maps User Guide (PDF, 842 KB)
Overview
National Agricultural Imagery Program (NAIP) is high resolution ‘leaf-on’ imagery flown for the United States Department of Agriculture (USDA).
The NAIP Point Digitizing (NPD) application collects training points from NAIP imagery for all states for all years to be used as input into supervised models, which can be used to classify imagery into various categories, such as healthy vegetation, dead, and dying trees.
The NAIP Prep Imagery (NPI) application is a National Agricultural Imagery Program (NAIP) image preparation tool to run Google Earth Engine (GEE) bioclimatic (BIOCLIM) models. It uses the collected training points captured in the NAIP Digitizing Tool (NPD) sister application.
This NPDI Status Maps application shows a map of which states are available and which have data that exist or is missing (if any) for either the NPD or the NPI application.
This application is run in the Google Earth Engine (GEE) site at code.earthengine.google.com.GEE is a web-based Interactive Development Environment (IDE) for the Earth Engine JavaScript API. GEE code editor features are designed to make developing complex geospatial workflows fast and easy.
The GEE site also features a large set of geospatial data and a repository for user created data. The site automatically brings more servers into service as needed without any coding.
The objective of this document is to introduce and describe the use of the Forest Health NPDI Status Map application in GEE. The application’s purpose will help to minimize any ‘behind the scenes work’ in the GEE script window and to allow for presentation of what work exists.
Acronyms and Abbreviations
| ABBREVIATION | ACRONYM |
|---|---|
| BIOCLIM | Bioclimatic Prediction and Modeling System |
| FAQ | Frequently asked questions |
| GEE | Google Earth Engine |
| GUI | Graphical User Interface |
| IDE | Interactive Development Environment |
| NAIP | National Agricultural Imagery Program |
| NPD | NAIP Point Digitizing |
| NPI | NAIP Prep Imagery |
| RGBN | Red-Green-Blue-Near-Infrared |
| SPA | Single Page Application |
| USDA | United States Department of Agriculture |
| UX | User eXperience |
Background
The Forest Service has been using GEE for remote sensing and risk mapping processes. The scripts written for GEE were developed in the JavaScript programming language. The scripts were developed for viewing aerial imagery and extracting data (point digitizing) from that imagery. The points and data obtained via the digitizing process are later input into a model that gives predictions for tree crowns or canopies that are either healthy (live) or unhealthy (dead or dying).
The resulting maps provide nation-wide assessments of forest health. The maps highlight areas affected by insects and disease. The accuracy of these models and maps are influenced by the quality and quantity of training points.
Many variables can sway the model into picking up non-treed areas. The soil/understory can be similar to red tree crowns (early stages of mortality). Gray canopies (later stages of mortality) can also share similar spectral characteristics to rocky outcrops and bare soil. Post processing methods, involving masking layers, are used to minimize confusion between trees and other features such as the forest understory.
Contents
The UI is a sequence of sections that are used to setup options for producing the status maps.
1-Select Type
The type of status map is selected either NPD or NPI. Checking one unchecks the other. One or the other must be checked to enable producing a status map.
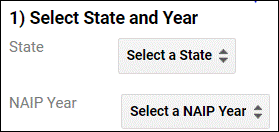
2-Select Year
NAIP imagery is available for several years. Once a year is published, there will never be any additions or modifications. This section allows for selecting a particular year.
When a year is selected:
The number of states that are available for the year is displayed in the label below the year selection.
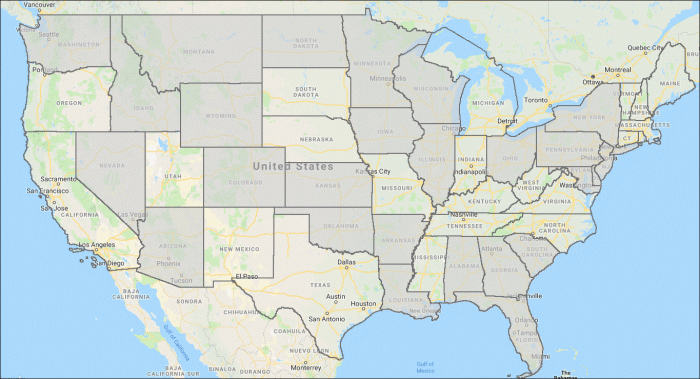
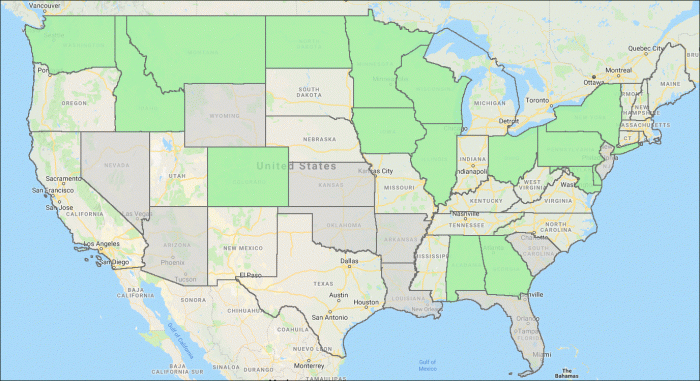
A map showing the available states is presented. The available states are shaded in a light grey.
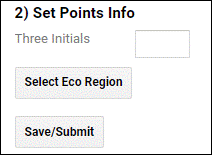
3-Results
Data may exist for some states and not for others. States will be added over time. This section is used to gather that information at the particular moment in time.
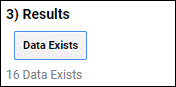
When the Data Exist button is pressed:
The number of states for which data exists for the year is displayed in the label below the button.
A map showing the states for which data exists is presented. The data exists states are shaded in a light green over the top of states that are available.
The states that are missing (if any) are shaded in a light pink.
NAIP is added to the legend with draw unchecked.
FAQ's
Yes
Use the NPD or NPI application.
A list of state postal abbreviations is shown in the console window.
GEE gets very busy sometimes. Wait a bit and the request will complete.
This is generally caused by using a browser other than Chrome. When running the application always do so in the Chrome Browser. In addition, keep your browser window maximized and the scripts code minimized.
The GEE interface windows can be dragged and sizable. It may have been minimized all the way. Adjust the length and width of the windows by clicking and dragging the three dotted bars at the top and sides.
GEE only allows one session per account and won’t function in a new session if the same Gmail is logged into GEE on another device.