

Online app provides national landscape change time-lapse imagery
The USDA Forest Service released its expanded Landscape Change Monitoring System, a publicly available dataset that combines remote sensing products (including Landsat imagery) with reference data to create meaningful spatial data products such as time-lapses showing annual vegetation change, land cover and land use. The release, developed by staff at the agency's Geospatial Technology and Applications Center in Salt Lake City, leverages work accomplished by a diverse science team represented by Forest Service researchers, academia and other government organizations. It expands LCMS’s coverage to the entire continental United States and South and East Coastal Alaska. The update also adds five new data layers covering 1985 to present.
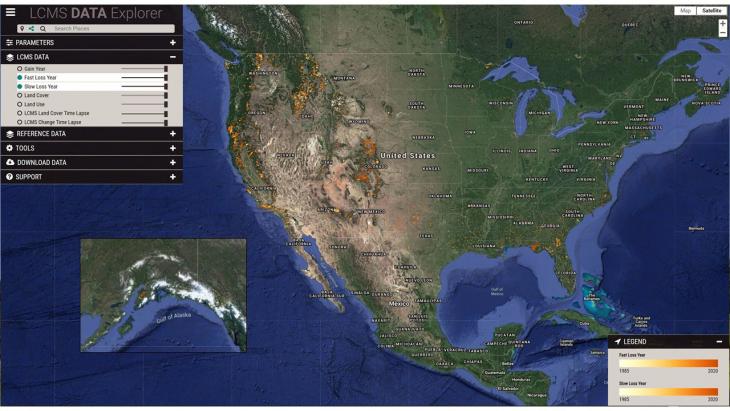
“We are thrilled to announce the release of the new LCMS dataset. The online LCMS Data Explorer’s increased geographic coverage allows agency and public users to view, analyze, summarize and download extensive imagery data showing landscape changes over time across the covered area,” said Deb Oakeson, center director.
Prior to the latest release, the system data covered only Region 4 (the Intermountain Region) of the National Forest System plus four other national forests. The updated data explorer also offers new kinds of data.
“In addition to the original vegetation loss data layer, users can now use LCMS to analyze vegetation gain, land cover, land use, fast loss and slow loss data layers,” said Kevin Megown, center program lead for Resource Mapping, Inventory and Monitoring. Megown oversees the team that updates and improves system data, its visualization tool, and user support.
How is the system’s data used? The center’s online data explorer was originally developed to leverage Forest Service research to visualize the process of change across a landscape. Managers then used it to make informed decisions for future management. For example, Forest Service regional and forest-level staffs have helped identify many applications for system data, including forest planning and revision, updating existing vegetation maps, assessing landscape conditions, supporting post-fire recovery, Forest Service Activity Tracking System analysis, disturbance tracking and meeting broad-scale monitoring requirements.
The data from the system has also been added to Google Earth engine, a publicly accessible research tool. Watch the silent animated video displaying annual vegetation loss and gain over the Blackrock Ranger District, Bridger-Teton National Forest.