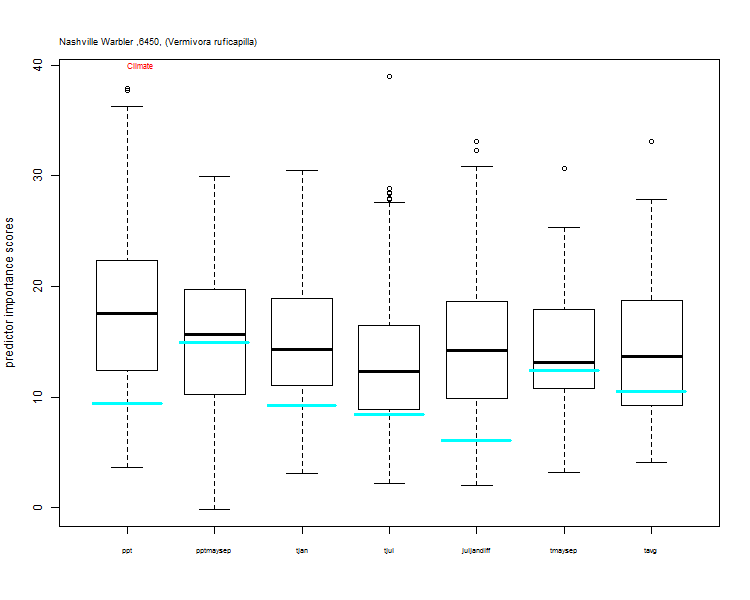
Nashville Warbler (Leiothlypis ruficapilla)Reliability of Model: High 
Climate Change Scenario Maps Help »

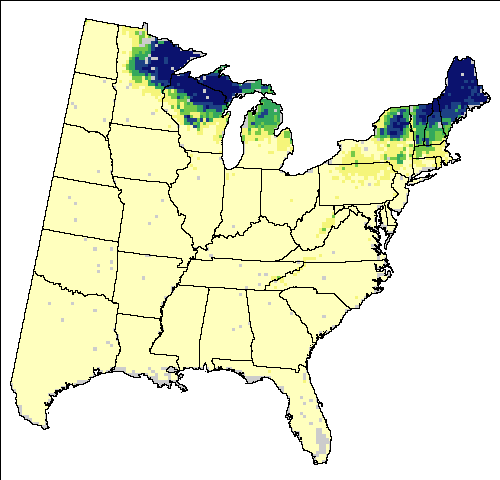
 of the species as calculated from the BBS data. The BBS Incidence (on a scale of 0 – 1) represents the proportion of times a species was observed on a route over a decade.")
HadleyCM3 – A1FI (High, "Harsh") Climate Scenario
")

Potential Changes in Abundance and Range (Future) |
|||||||||
|---|---|---|---|---|---|---|---|---|---|
| GCM SCENARIO | % Area Occ | Ave IV | Sum IV | Future/Current IV | |||||
| Current Modelled | 15.2 | 0.489 | 724.4 | ||||||
| Current Breeding Bird Survey | 2 | 0.606 | 116.3 | ||||||
| HadleyCM3 – A1FI (High, "Harsh") Climate Scenario | 8.2 | 0.223 | 178.4 | 0.246 | |||||
| PCM – B1 (Low, "Mild") Climate Scenario | 10.1 | 0.432 | 426.8 | 0.589 | |||||
| Avg. of 3 GCMs – A1FI (High) Climate Scenario | 8 | 0.256 | 198.6 | 0.274 | |||||
| Avg. of 3 GCMs – B1 (Low) Climate Scenario | 9.2 | 0.355 | 318.6 | 0.44 | |||||
Notice:
This is an version 2 of the Climate Change Bird Atlas. You can view the previous Nashville Warbler page or browse the previous Bird Atlas. Version 2 of the Bird Atlas is based on Version 3 of the Climate Change Tree Atlas.

Photograpger: K.T. Karlson
Species Information
- Family:
- Parulidae
- Breeding Status:
- neotropical
- Primary Breeding Diet:
- insects
- Habitat:
- shrubland
Search for Trees & Birds:
 Click and drag the orange handle over the maps to compare.
")
 HadleyCM3 – A1FI (High,")
 Current Modelled")


")